What is it and why would I use it
These views allow you to understand the structure of your data entities and the relationships between them. They will help you to visualise the data and to spot relationships that may be missing.
Definitions
The Data definitions tab allows you to view the structure of your data entities.
You can view the list of definitions by viewing the Data Dictionary page (1). Select the Definitions tab (2). You can search for your definitions, if there is a long list, by displaying the search bar (3)(4). Then selecting the definition you are interested in (5).
You can create a new definition on this tab (6). However, you are likely to create one as part of creating a data activity or adding a connection. There are more details on definition creation in the Data Dictionary and Register a definition guides.
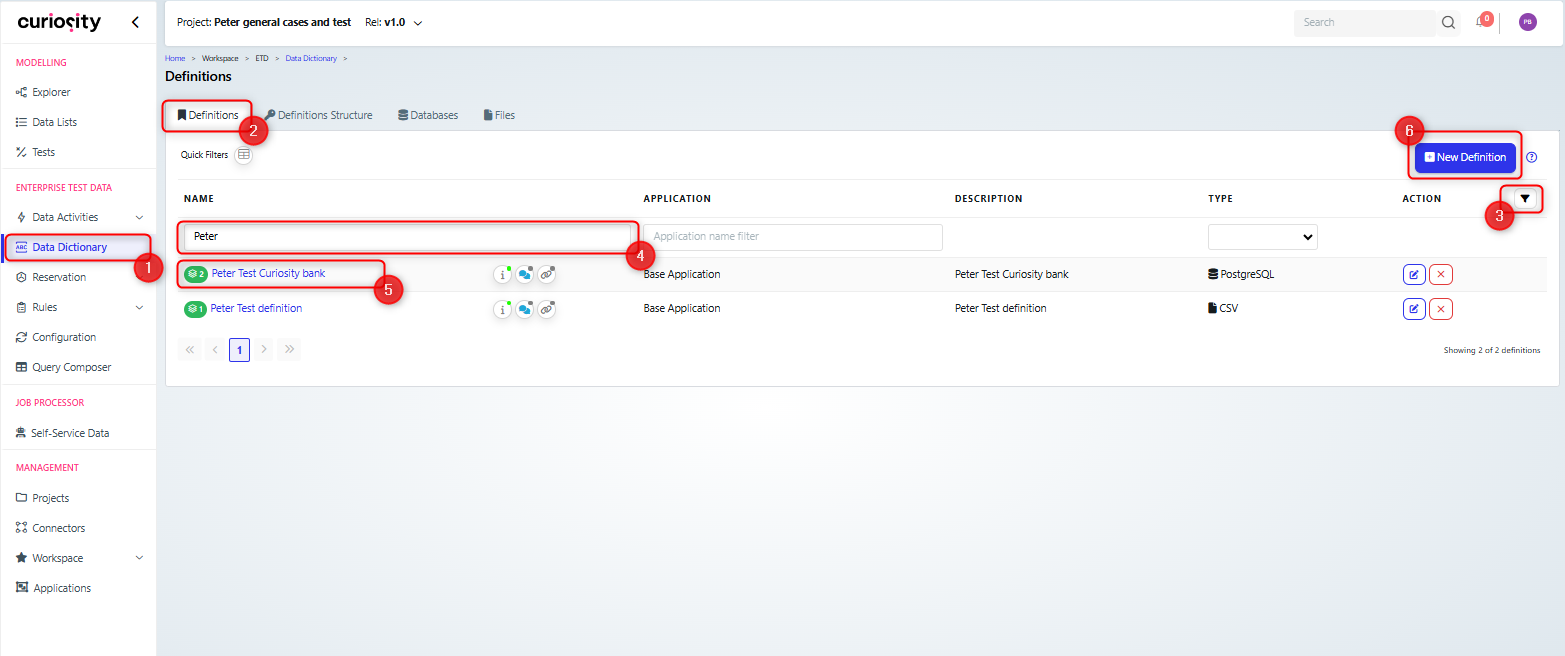
Note that there are a number of different types of definition, so as well as viewing the structure for your database, you can also add and view datafile types such as CSV or swagger structures.

The view of the definition will depend upon whether it is database, file or swagger. But they all allow you to view the structure of the entity.
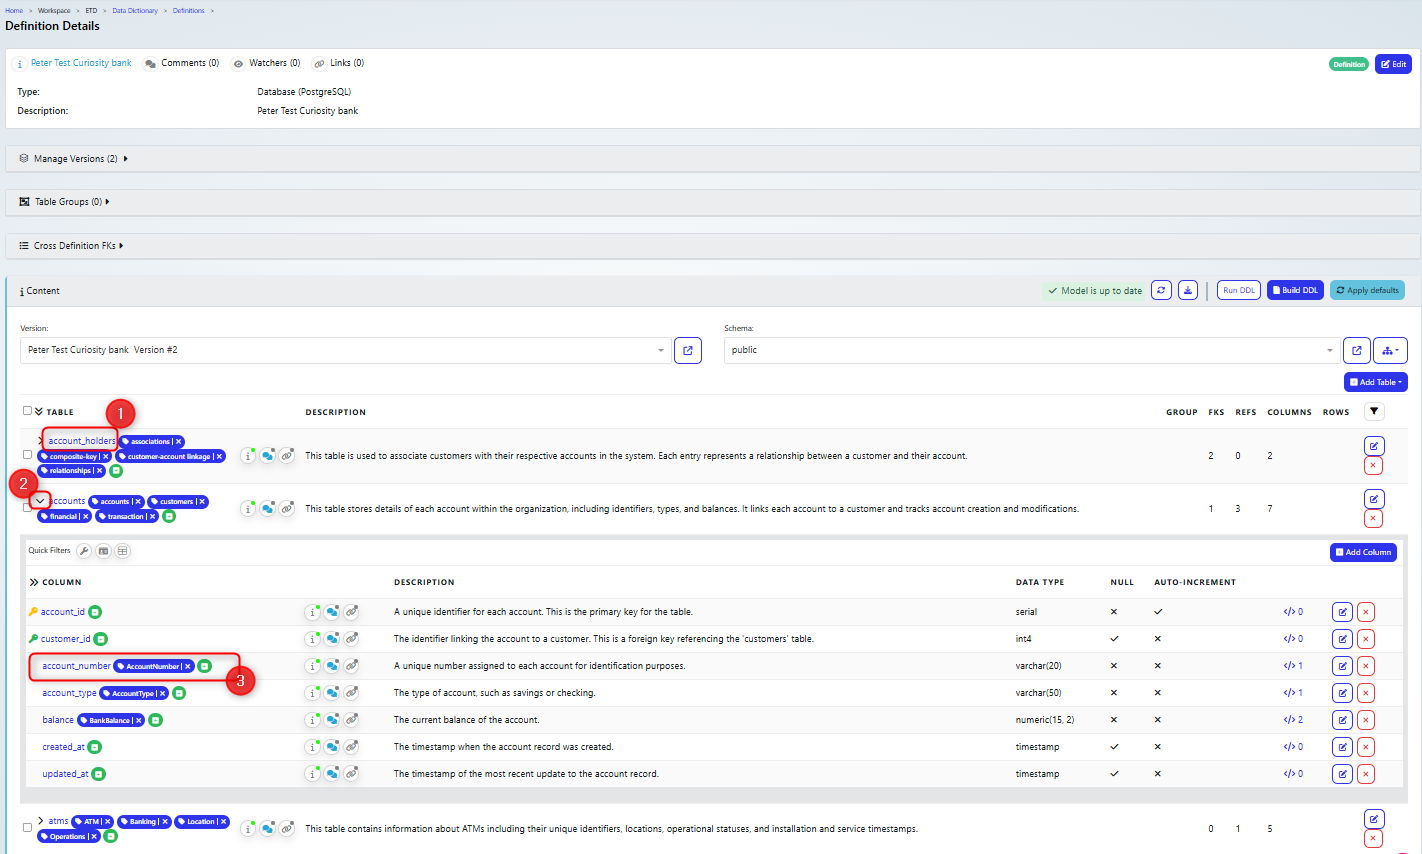
In the example below you can see a typical database structure, you can view more details for a table by clicking the table name (1). Alternatively you can expand the table view (2), to see the list of columns, which are also clickable for more details (3).
Comparing database versions
As your database matures and changes, you will need to carry out additional scans to create new versions of your definitions, the scanning process is covered in the Data Dictionary guide.
Once you have created multiple versions then you can review the changes that have been made in your database.
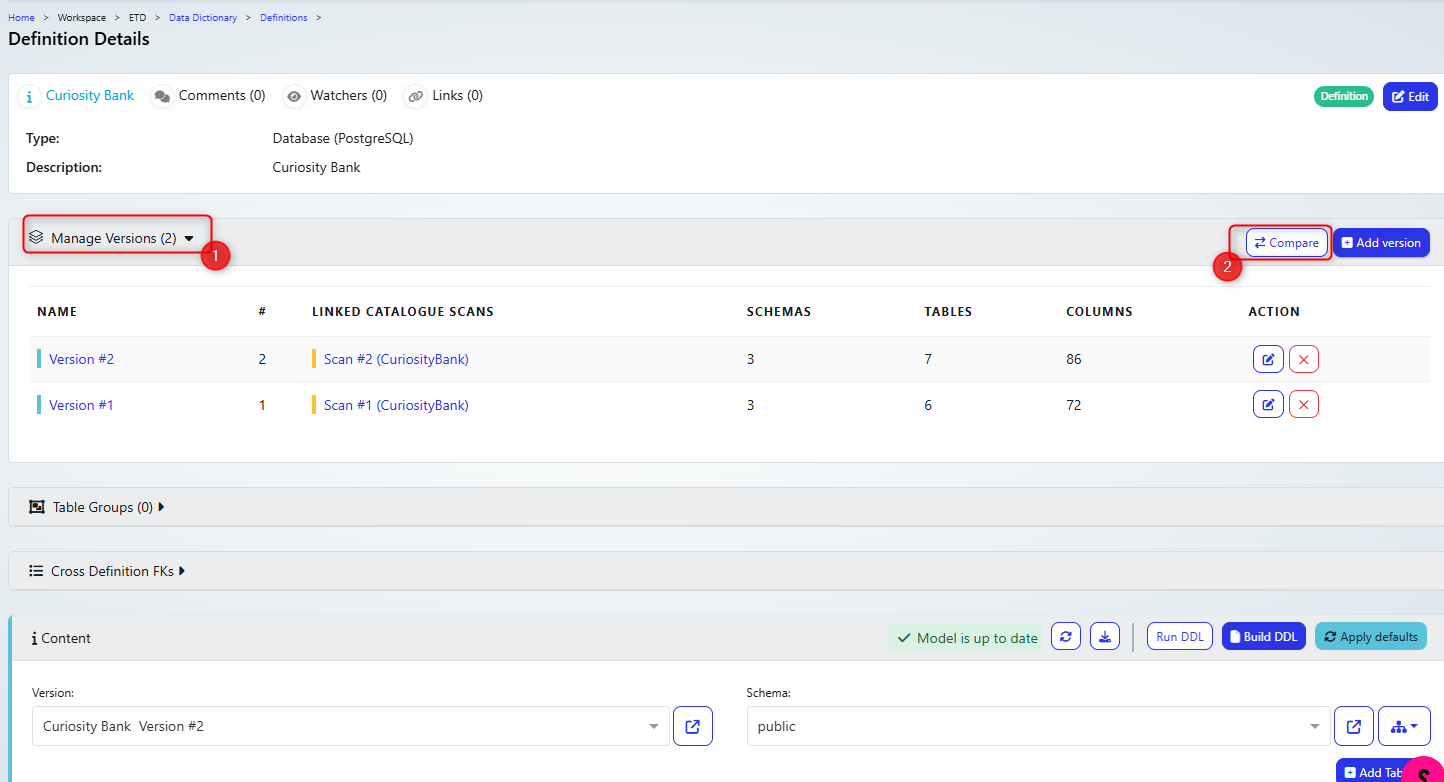
On the Definition details page, the versions of the definition are listed in the Manage Versions (1) section, and there is a button to allow you to compare the versions (2)
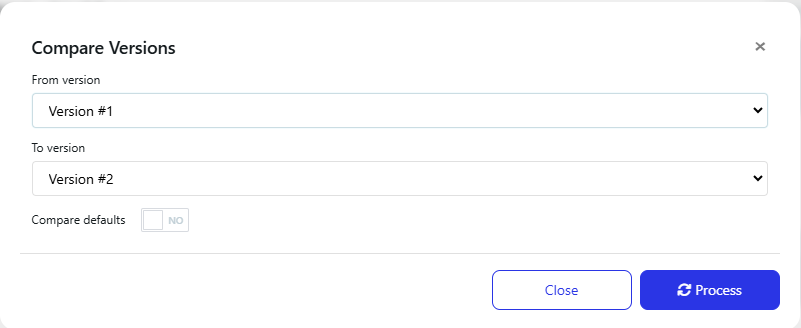
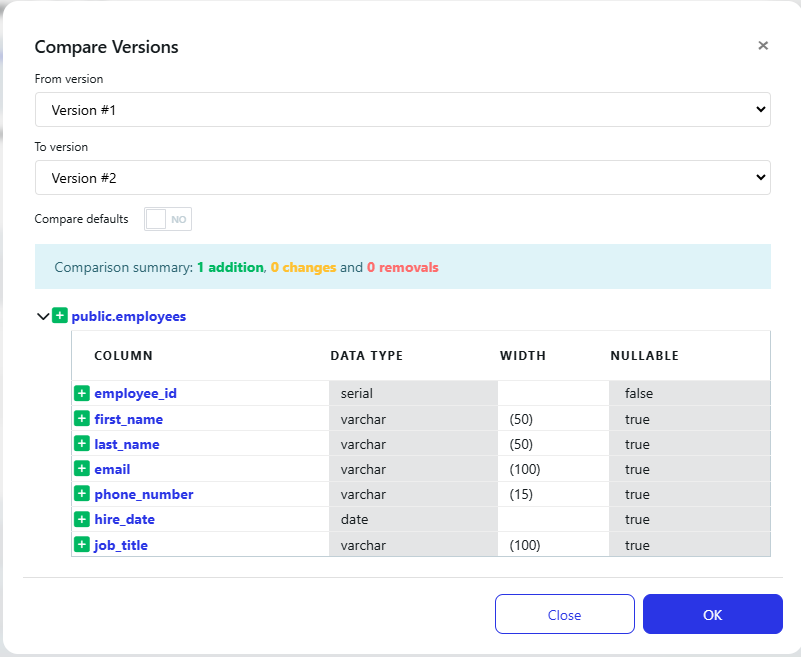
The compare versions dialog box allows you to pick the versions to compare
When you click process, then you will see the changes. In this case, a table was added, but you would also be able to see any tables that have been changed or removed.
Definitions Structure
The definitions structure tab (2) is a list of the definitions that you have, which allows you to see the relationships between the data entities described in the definition. It is accessed from the Data Dictionary page (1). You can search for your definition (3)(4).
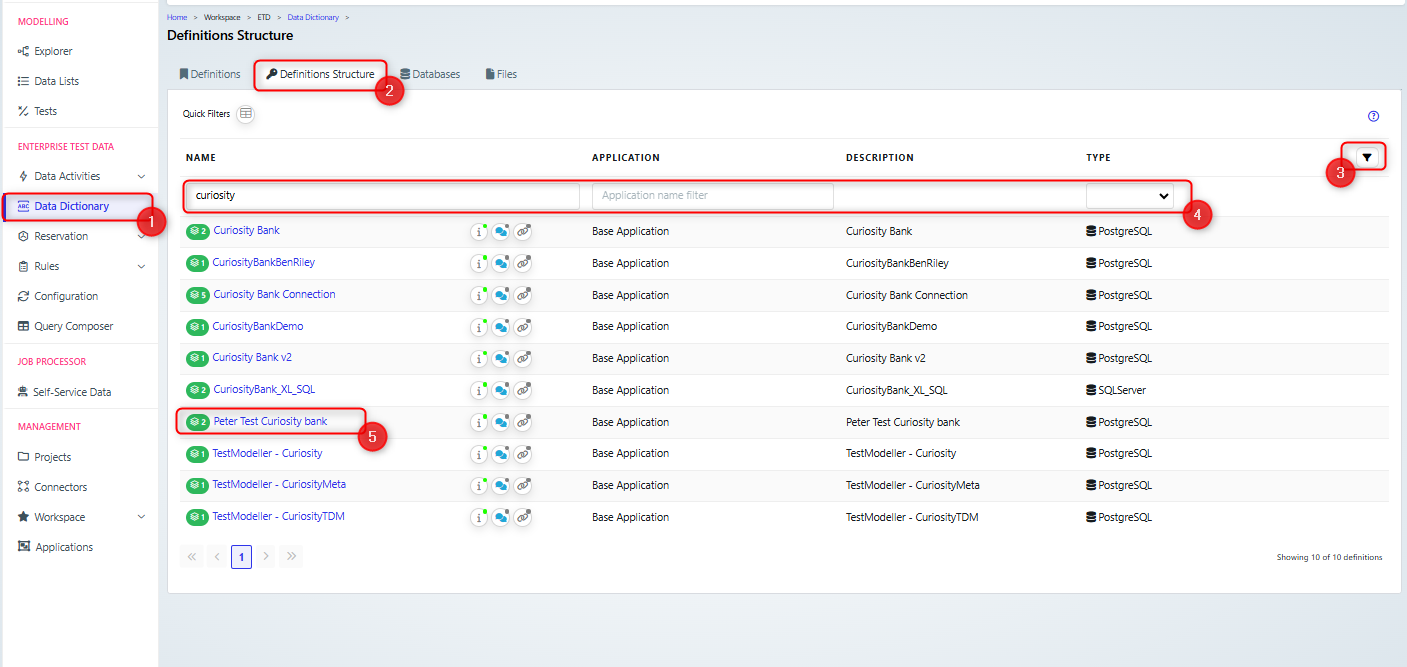
Then select one to view the structure (5).
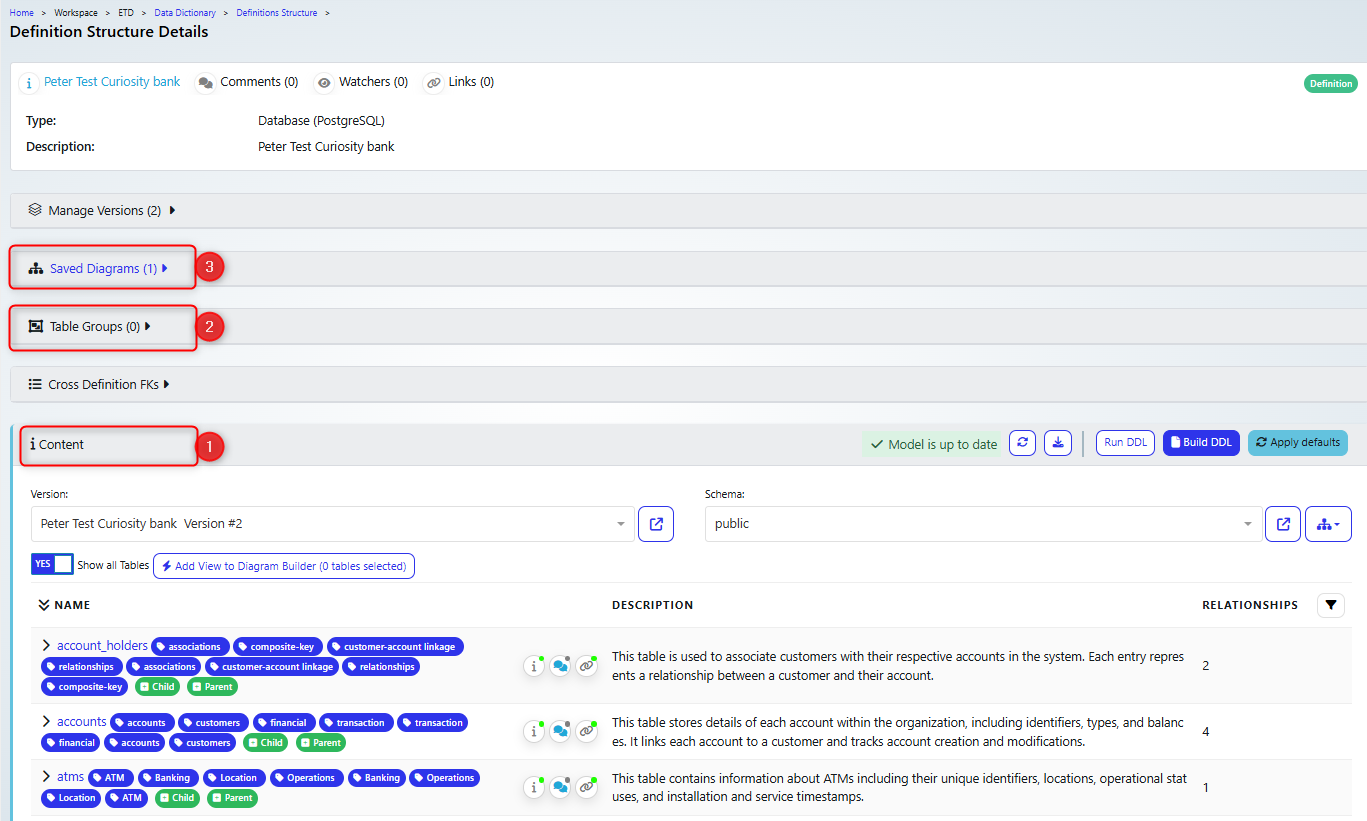
The structure details view is split up into different sections, including content(1), Table Groups(2) and Saved diagrams(3), which are listed in more detail below.
Content
In this section, you can view the relations between tables by expanding the table view (1) to expose the relationships between tables and navigate down them (2)(3)(4)(5).
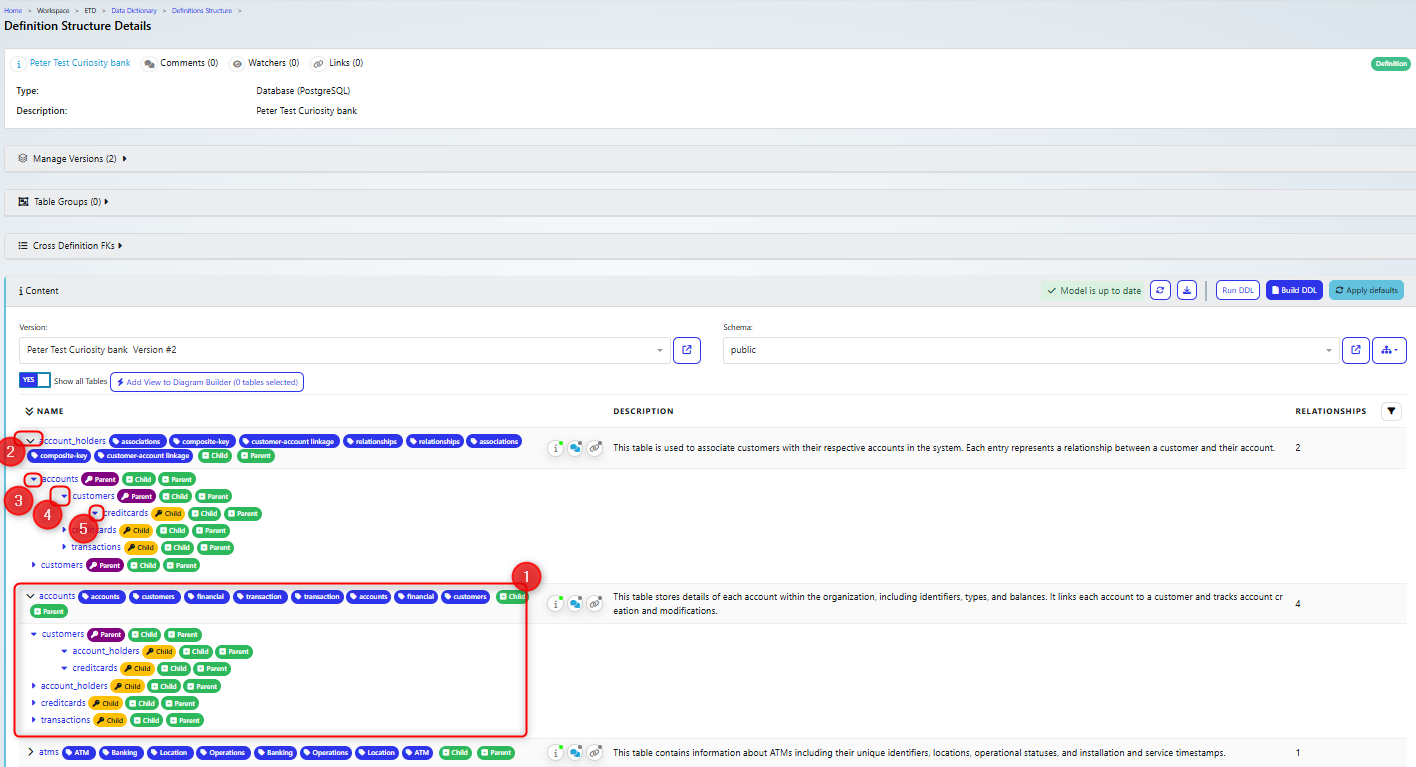
As well as showing the structure, you can see if any foreign keys are missing from your tables.
Note that you can hide tables that have no relationship with other tables (1)
You can build diagrams based on the relations between the tables, by clicking “Add view to…” (2) and selecting the diagram to build (3).

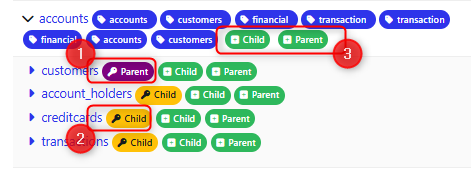
You can also see the type of relationship between tables: parent (1) or child(2) and you can add new ones by clicking +Child or +Parent(3).
Below is an example of an entity relationship diagram for the tables in the previous screenshots. Note that you can save the diagram and it will be listed in the saved diagrams section.
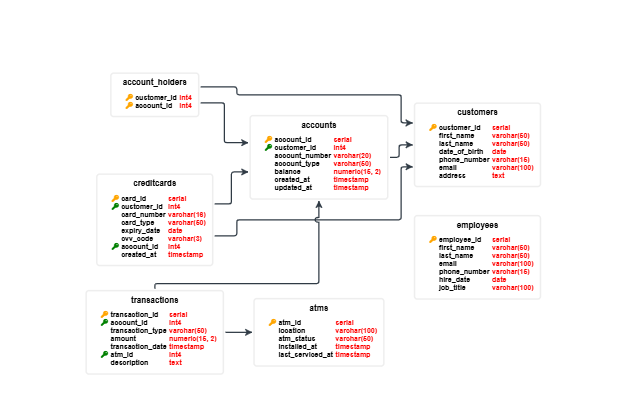
Table Groups
To help organise your data, you can group your tables.
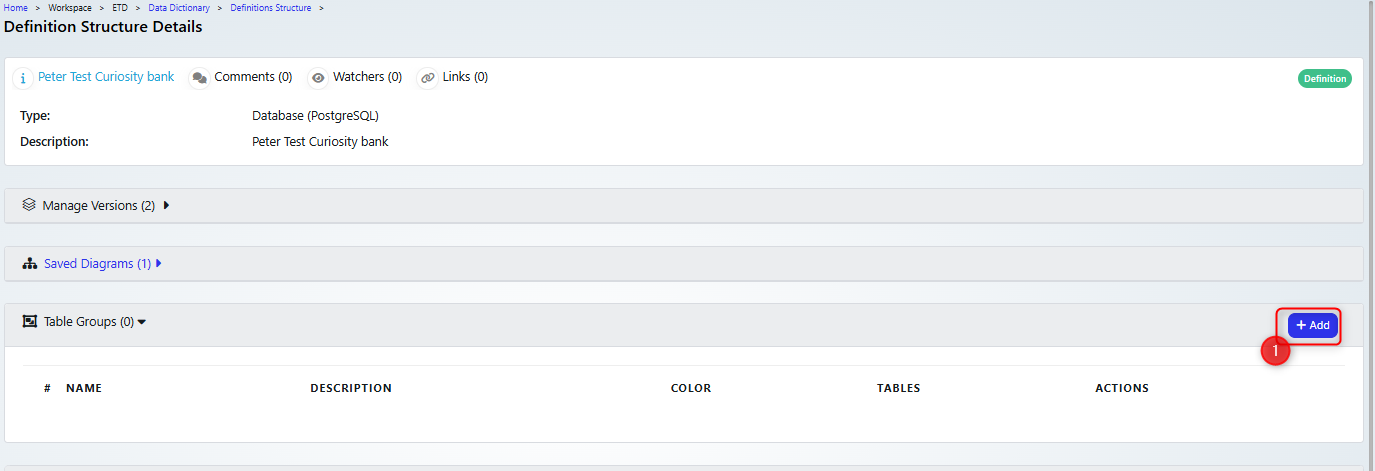
Click +Add (1) to add a group
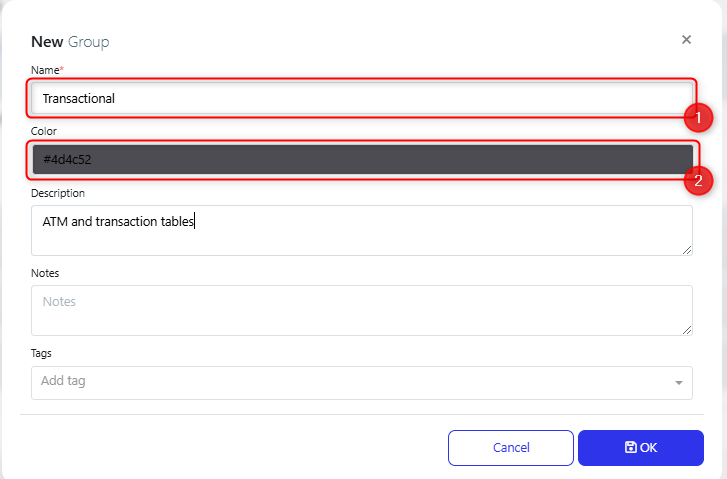
This opens the add group dialog, where you can give it a name (1) and assign a colour (2), as well as any description, notes and tags.
Once you have created the group you can click on the name (1) to add tables to it

On the Table Group details page, you can click the Add Tables button (1) to add tables. You can also edit the group details as well (2)

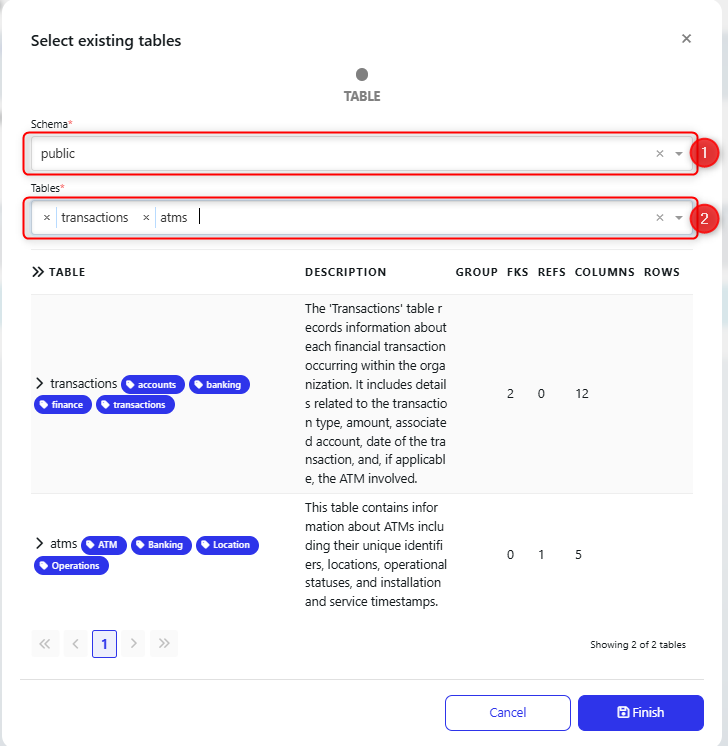
When selecting tables you should ensure you are using the correct schema (1), then choose tables in the multi-select drop down box (2)
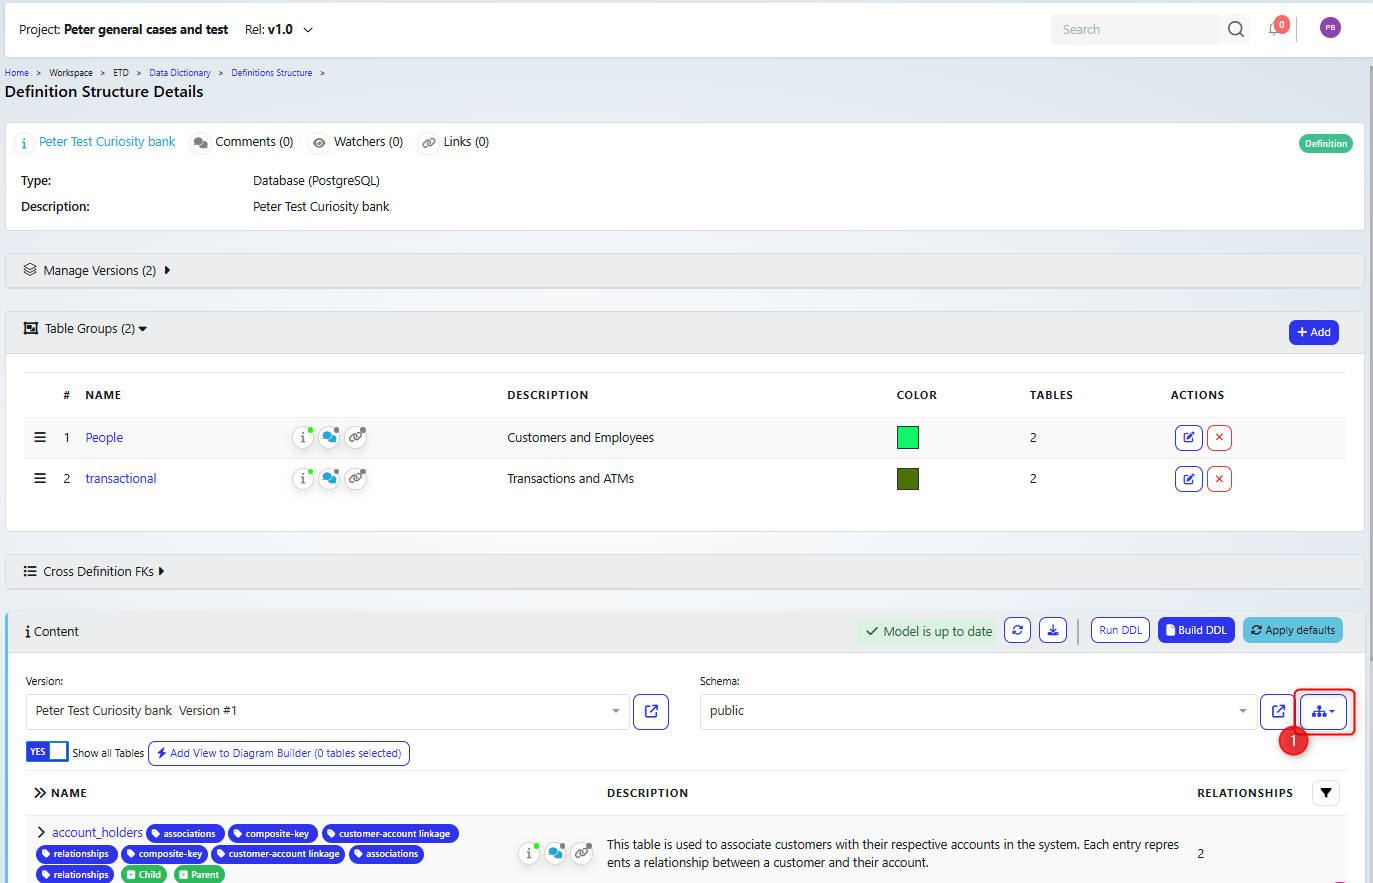
Then back on the Definition Structure details view, you can click to show the entity relationship diagram (1), or on a saved diagram and view the groups there.
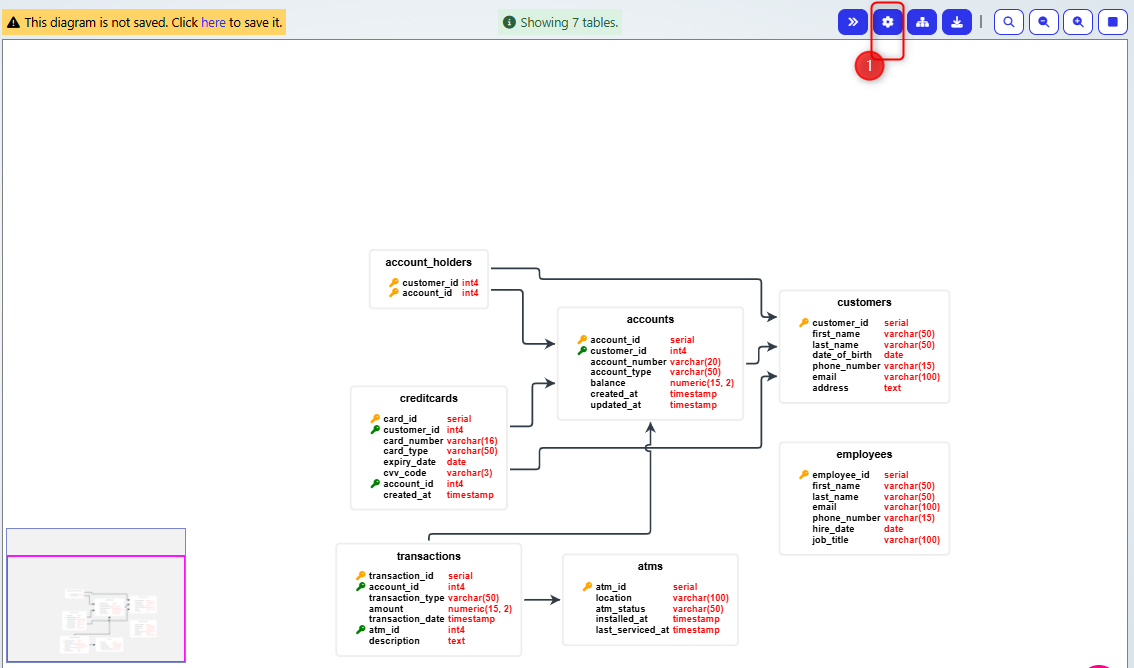
On the diagram, click the settings button (1)
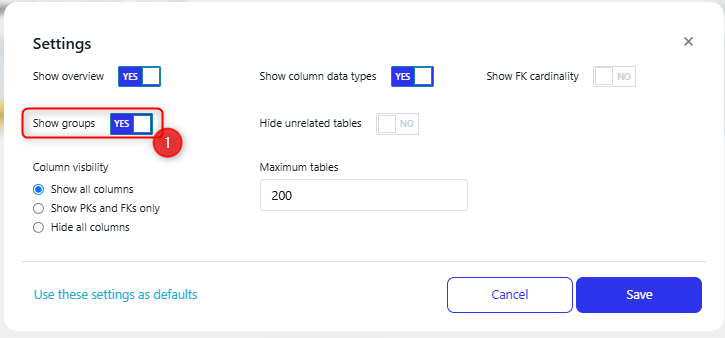
Then set show groups (1) to on.
You can grab tables and move them around in the diagram
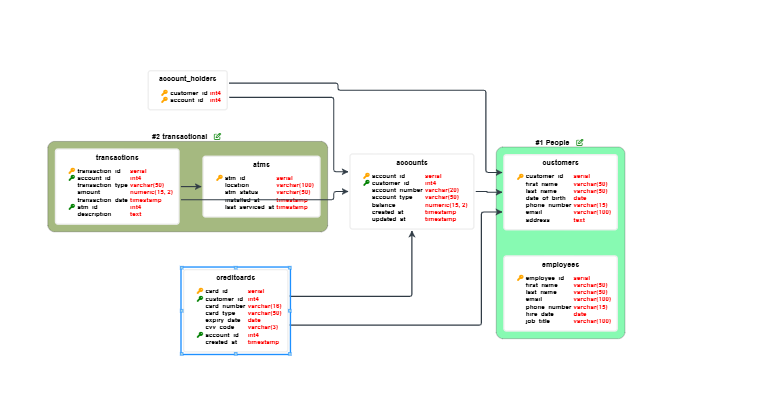
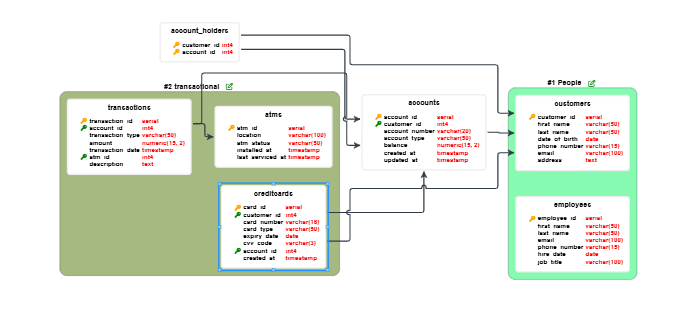
You can even drag them into a group.
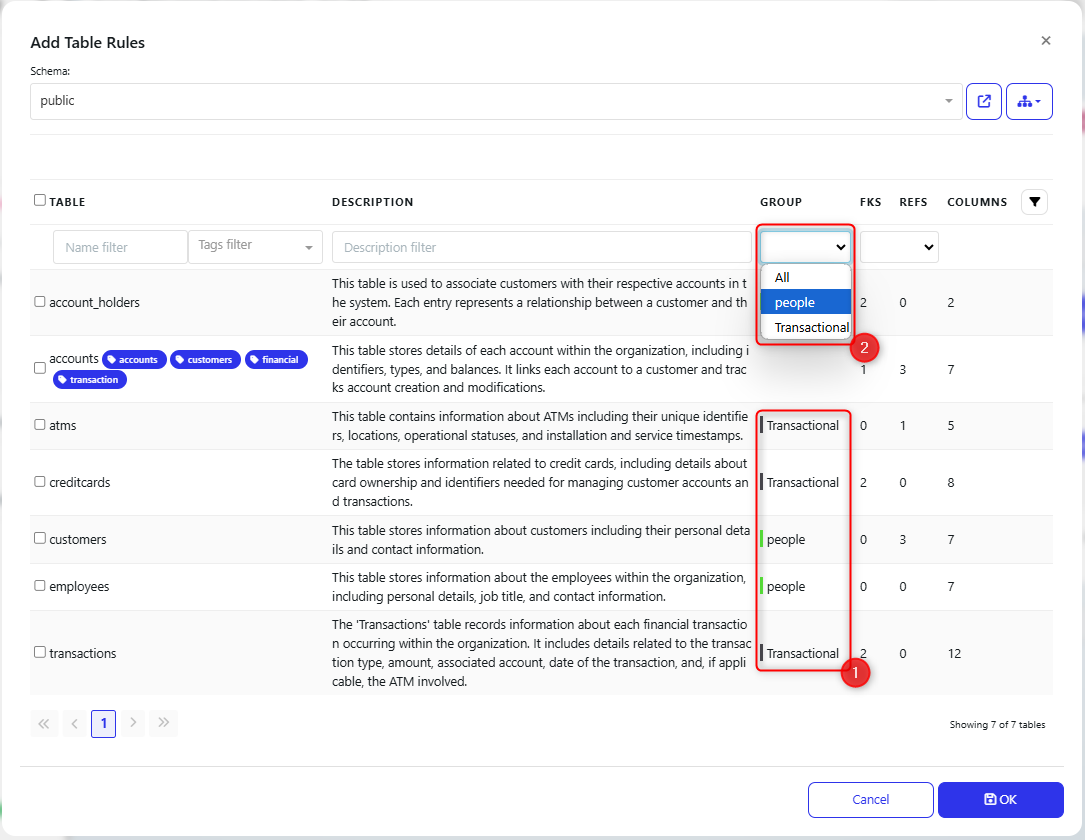
Once you have created groups for a definition, those groups can be used to filter tables where ever tables are selected, for example, below where we are adding table rules in data masking. We can see the group names (1) and could filter using the group (2).
Saved Diagrams
If you have saved any diagrams for this definition, then the Saved diagrams section(1) will appear, and they will be listed for you to view (2).
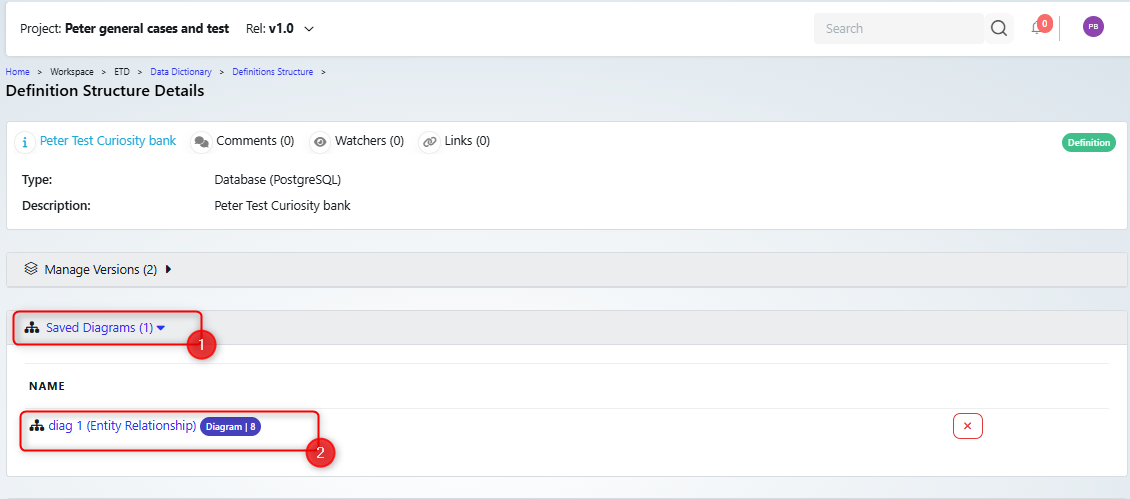
Note that diagrams are linked to a version, so if you create a new version, then you will need to recreate any diagrams.