This guide covers everything you need to train with TVAE (Tabular Variational Autoencoder) to produce a model which can be used to generate synthetic data with the same characteristics as your source data.
Section | What it covers |
|---|---|
Step-by-step: create the activity and train a model | |
What TVAE is, how it works and when to choose it | |
Activity settings and every TVAE parameter, with tuning advice | |
What training produces, how to read the log and when to retrain | |
Which columns to train on and which to leave out | |
Generating data, checking it against the source and fixing issues |
The example dataset
New to machine learning? Load our ML Sample Dataset - Lending into your database first then work through this guide with the CUSTOMER table on its own first, then add the other tables once you're comfortable.
The examples in this guide use the CUSTOMER table from a synthetic consumer-lending dataset. It has 12,000 rows, one per customer, and 11 columns:
Column | Type | What it holds |
|---|---|---|
| Text | Unique identifier, e.g. |
| Date | When the customer relationship started |
| Whole number | Months since |
| Category | Six bands, |
| Category | Five bands. About 7% of values are missing |
| Category |
|
| Category | Eight regions across Ireland and the UK |
| Category |
|
| Whole number | 473–850 |
| Decimal | 1,000–40,000, in steps of 500 |
| Decimal | Debt-to-income ratio, 0.05–0.65 |
It mixes categories, whole numbers and decimals, includes missing values, and has strong relationships between columns. For example, customers with higher credit scores have higher credit limits. Those are the things you'll check the synthetic data for.
1. Training
Before you start, you need:
A connection to your source database, scanned into the Data Dictionary
A Database Definition built from that connection
Create the data activity
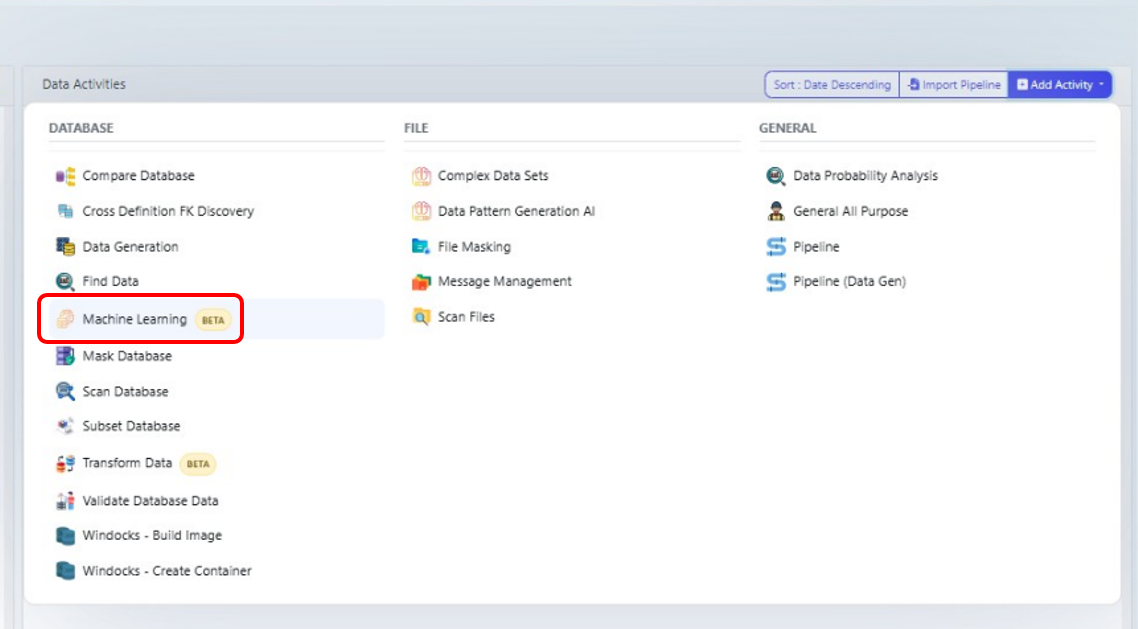
1. Create a Machine Learning data activity. Go to Data Activities and create a new activity of type Machine Learning.
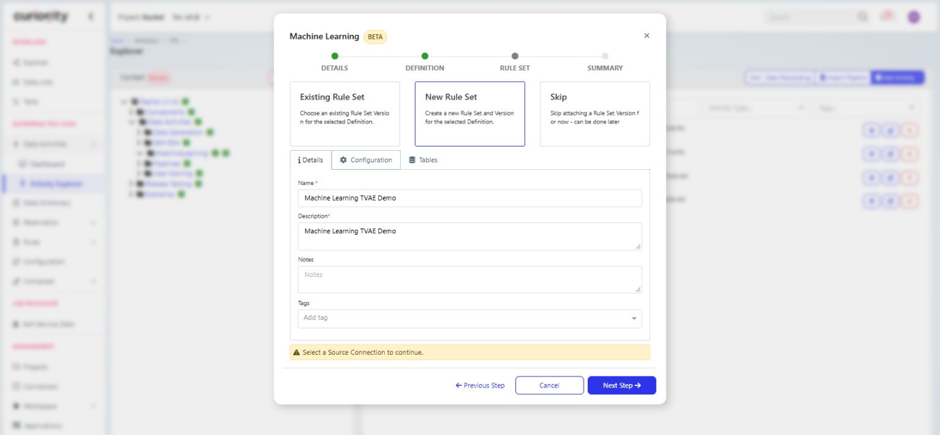
2. Add a name and description. Use a name you'll recognise later, such as Customer – TVAE. In the description, note the table and engine you're training.
3. Select a Database Definition and rule set. Select your Database Definition, then choose New Rule Set. If you already have a training rule set for this data, choose Existing Rule Set instead.
Configure the activity
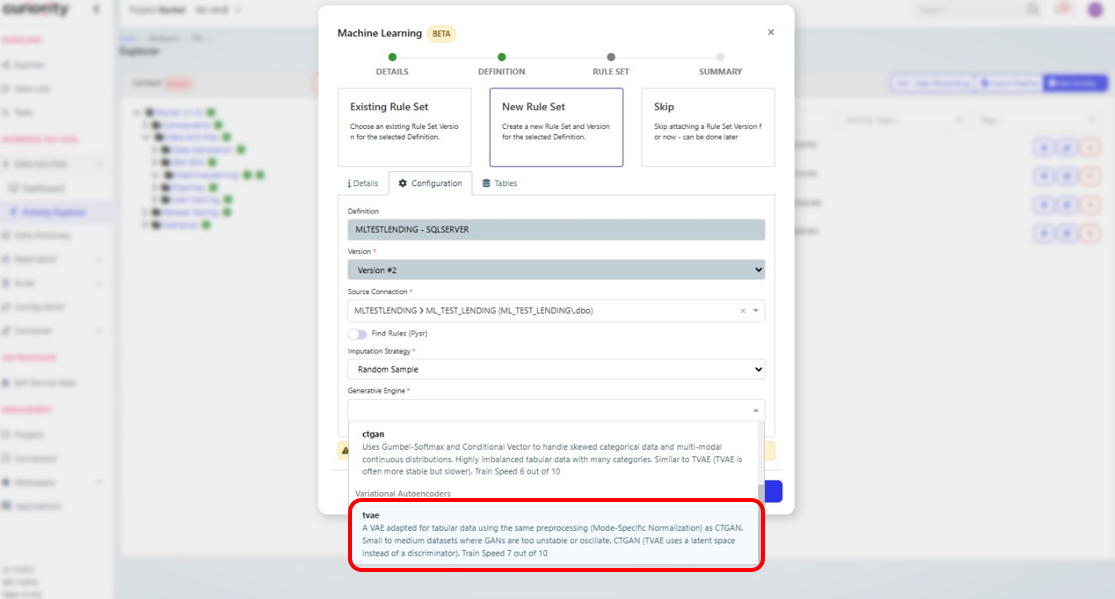
4. Select the source connection. On the Configuration tab, select the Source Connection the training data is read from.
5. Leave Find Rules off. It adds significant training time, and on a first run you want to confirm that everything completes. See Activity settings.
6. Set Imputation Strategy to Random Sample. It keeps each column's real proportions and works for every column type. See Activity settings.
7. Set Generative Engine to tvae. See 2. Engine for why you'd choose it.
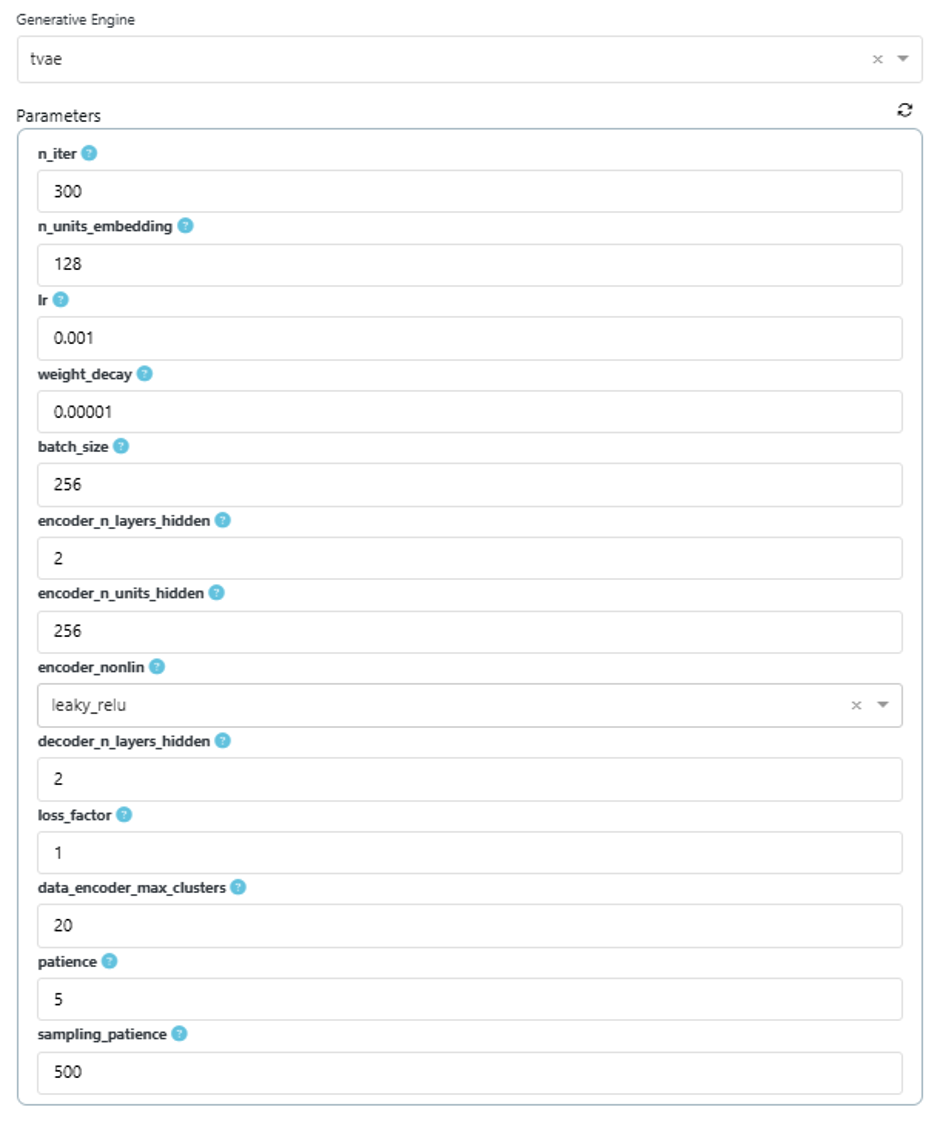
8. Set the engine parameters. For a first run on the example dataset, use the starting values in Suggested starting values.
Choose tables and columns
9. Select your tables. On the Tables tab, check the table(s) you want and click Add Selected. Start with one table. It's the quickest way to confirm everything works before you add related tables.
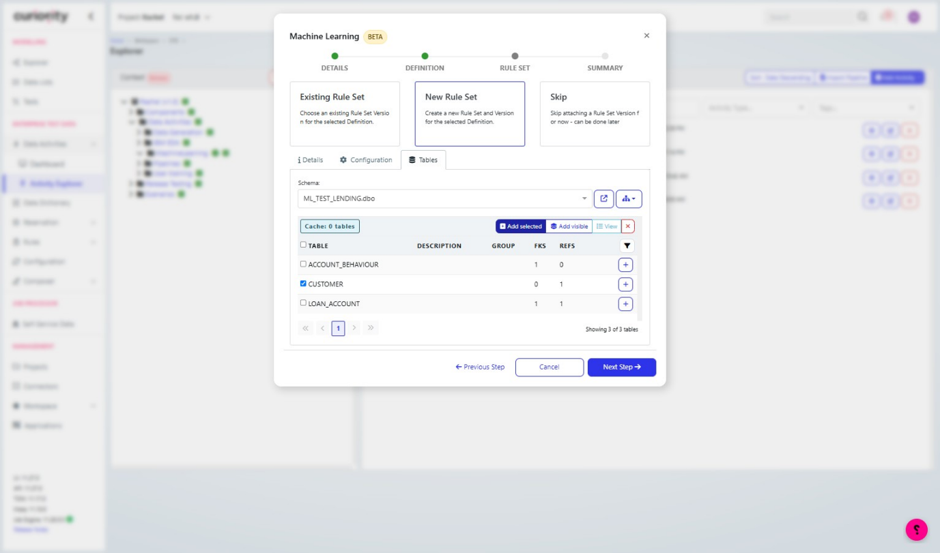
10. Finish the wizard. Click Next, then Finish. Your new data activity opens.
11. Run Analyze (optional). From the Actions panel, choose Analyze. It confirms the data can be read and suggests post-processing rules, such as the valid range of each numeric column. Relationship suggestions only appear when your rule set includes related tables. See Analyze.
12. Set which columns are active. Open your training rule set and expand your table. Make identifiers and repeated information inactive. In the example, customer_id and open_date are inactive. See 5. Column Inclusion / Exclusion Guide.
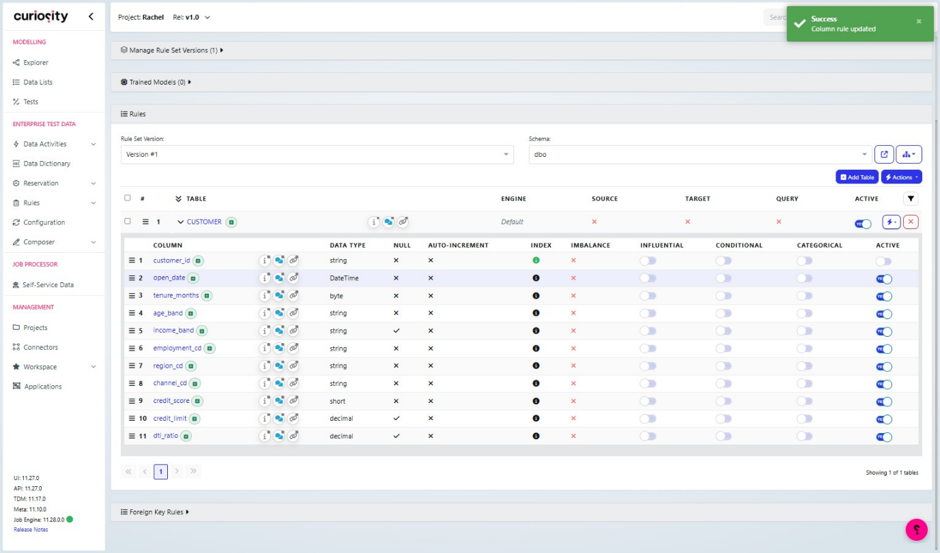
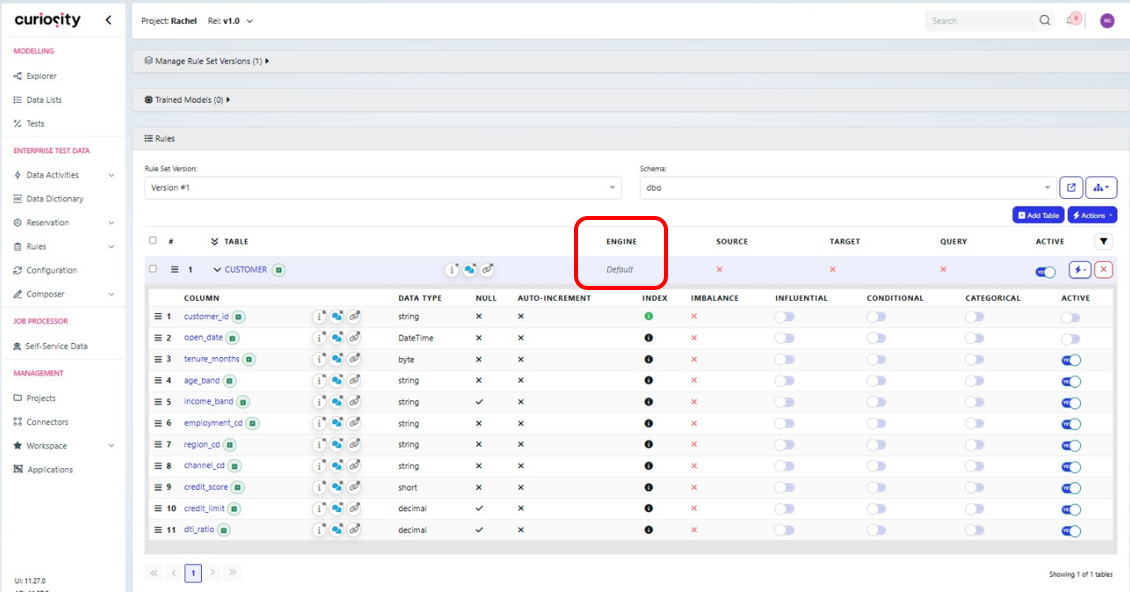
13. Set the engine at table level. In the same rule set, set the table's generative engine to tvae. A table-level engine overrides the one on the Configuration tab for that table.
Train
14. Train the model. Go back to the dashboard and select Train Model.
15. Check the log. Within the first minute, open the job log and find the line beginning Fit internal model. Confirm it says tvae and shows the parameters you set. If it doesn't, stop the job and check steps 7 and 13. See Reading the training log.
When training finishes, the model is attached to the activity and its output files are available to download. See 4. Model.
2. Engine
What TVAE is
TVAE is a neural network made of two halves:
The encoder takes a row of your data and compresses it into a short list of numbers, called the latent representation.
The decoder takes that list of numbers and rebuilds the row.
During training, the model learns to rebuild rows accurately. It also learns to keep the compressed space smooth and evenly spread out. Because the space is smooth, you can pick a random point in it, pass it through the decoder, and get a new row that looks like your real data but isn't a copy of any real row. That's how generation works.
Before training, each column is converted into a form the network can use:
Categories are split into one yes/no value per category.
Numbers are grouped into clusters, and each value is stored as its cluster plus its position within that cluster. This helps the model handle columns whose values bunch into several groups. The number of clusters is set by
data_encoder_max_clusters. See 3. Hyperparameters.
How TVAE compares with the other engines
tvae | ctgan | bayesian_network | |
|---|---|---|---|
Type | Neural network (autoencoder) | Neural network (two competing networks) | Probability graph |
Best for | Small to medium tables with mixed categories and numbers | Imbalanced data with many categories | Small to medium tables where you want to see the relationships |
Training stability | Good | Can be unstable | Good |
Speed (platform rating) | 7/10 | 6/10 | 8/10 |
Can you see what it learned? | No | No | Yes, as a graph of dependencies |
When to choose TVAE
Choose TVAE when:
Your table mixes categories and numbers, and relationships between columns matter
You want a neural model but ctgan is unstable or slow on your data
You don't need to see which columns depend on which
Choose something else when:
You need to explain or inspect the relationships the model found. Use bayesian_network.
One or more category columns are very imbalanced (a rare value in under 1% of rows) and must still appear. Try ctgan.
The table is very small, with a few hundred rows or fewer. Neural models are more likely to copy real rows. Use bayesian_network, or check the output with
privacy_similarity_score.
Global engine vs table-level engine
You can set the engine in two places:
Configuration tab: the default engine for the activity.
Table level, in the training rule set: the engine for that table.
The table-level setting wins. Set both to tvae and confirm in the log (see Reading the training log).
CPU vs GPU
TVAE runs on the CPU unless the server has a GPU. On CPU it trains noticeably slower than bayesian_network. If the log includes CUDA libraries not found, you're on CPU. Reduce n_iter for a first run so you get a result sooner.
Do I need a target column?
Usually not. TVAE learns how all the columns relate to each other, so no single column is treated as the answer. A target column is only needed when one column should drive the rest of the generation.
The example CUSTOMER table has no outcome column in any case. The default flag in this dataset is held on the loan table.
3. Hyperparameters
A hyperparameter is a setting you choose before training. It controls how the model learns, as opposed to what it learns from the data. Changing a hyperparameter means you need to retrain.
Activity settings
These two settings are on the Configuration tab and apply to the whole activity, whichever engine you use.
Find Rules. Searches for mathematical formulas linking your columns, such as one column being another divided by a third. It adds significant time to training. Leave it off for a first run, and turn it on later if you suspect columns are calculated from each other.
Imputation Strategy. Decides how missing values are filled before training.
Option | How it fills a gap | Use for |
|---|---|---|
Random Sample | A value drawn from the column's existing values | Any column. Recommended default |
Mode | The most common value | Categories |
Least Frequent | The least common value | Rarely useful |
Mean | The average | Numbers only |
Median | The middle value | Numbers only |
Zero | 0 | Numbers where missing genuinely means zero |
Random Sample keeps each column's proportions closest to the real data. Whichever option you choose, the model also records which values were originally missing, in an extra column called <column>__missing_indicator. This lets it learn the pattern of what's missing as well as the values.
TVAE parameters
Defaults shown are the engine's standard values. The form on your platform version may show different defaults or a subset of these parameters.
Training length and pace
Parameter | Default | What it does |
|---|---|---|
| 1000 | Number of training rounds (epochs). Each round passes through all the training data once. More rounds give the model longer to learn, and take longer to run |
| 500 | Rows the model looks at before each update. Larger is faster per round but can learn less detail. Keep it well below your row count |
| 0.001 | Learning rate: how big a change the model makes at each update. Too high and training is erratic; too low and it's slow to improve |
| 0.00001 | Small penalty that discourages the model from relying on extreme internal values. Helps prevent it memorising the training data |
Network size
Parameter | Default | What it does |
|---|---|---|
| 500 | Size of the compressed representation each row is squeezed into |
| 3 | Number of layers in the encoder |
| 500 | Size of each encoder layer |
| 3 | Number of layers in the decoder |
| 500 | Size of each decoder layer |
|
| Mathematical function applied between layers. Rarely needs changing |
More layers and larger layers let the model capture more complex patterns. They also take longer to train, use more memory, and make it easier for the model to memorise rows on a small table.
Regularisation
Parameter | Default | What it does |
|---|---|---|
| 0.1 | Share of the encoder's connections randomly switched off during each update. Stops the model depending on any single connection, which reduces memorising |
| 0 | The same, for the decoder |
| 1 | How much weight the model gives to rebuilding rows accurately, compared with keeping the compressed space smooth. Higher values favour accuracy; lower values favour variety |
| 1 | Caps how large a single update can be, to stop training becoming unstable |
Data encoding and generation
Parameter | Default | What it does |
|---|---|---|
| 10 | Maximum number of clusters each numeric column is split into. More clusters capture more detail, such as a sharp threshold, at the cost of more memory and training time |
| Off | Reduces the data before training. Leave off unless the table is very large |
| 500 | Number of attempts the engine makes to produce a valid row before giving up |
Suggested starting values
For a first run on a table like the example (around 10,000 rows, a mix of 5–10 category and numeric columns, CPU only):
Parameter | Value | Why |
|---|---|---|
| 300 | Enough to learn the main patterns and finish in a reasonable time on CPU. Increase once the process works |
| 500 | Default. Around 24 updates per round at 12,000 rows |
| 0.001 | Default |
| 128 | A smaller compressed space suits a table with around 10 columns and trains faster |
Network layers and units | Defaults | Change only if the output shows the model missing relationships |
| 0.1 | Default |
| 1 | Default |
| 10 | Default. Raise it if numeric columns come back too smooth |
Tuning: which setting to change
Change one setting at a time and compare each run against the source.
What you see in the output | Try |
|---|---|
Distributions or relationships are weak across most columns | Increase |
Numeric columns look too smooth, or a sharp step in the data is lost | Increase |
The model still misses relationships after longer training | Increase |
Rows look too similar to each other, with little variety | Lower |
Synthetic rows are copies, or near-copies, of real rows | Increase |
Training is erratic, or fails partway through | Lower |
Training is too slow or runs out of memory | Lower |
4. Model
What a trained model is
A trained model is the result of a training job, attached to your data activity. It contains everything the engine learned from your data. It takes a snapshot of the training rule set when the job starts, so changes you make to the rule set afterwards don't affect a model that's already trained.
You use the model by selecting it in a generation rule set (see 6. Generate and Validate).
Output files
When training finishes, these files are available to download:
|
|
See Training output files for more detail.
Reading the training log
Open the job log shortly after training starts and check these lines.
Engine and parameters:
Fit internal model 'tvae' for table '<table>' with params: {...}
Confirm the engine is tvae and the parameters match what you set.
Columns and types:
type_metadata_mapping: {'CUSTOMER': {'integer_cols': [...],
'float_cols': [...], 'categorical_cols': [...]}}
Check that inactive columns are missing from this list, and that each column is classed as you'd expect. A number stored as text, for example, would appear under categorical_cols.
Category encoding:
VERIFY [CUSTOMER][channel_cd]: [('BRANCH', 0), ('BROKER', 1), ('ONLINE', 2)]
Each category is listed with the number it's stored as. Check for unexpected values, such as a misspelling or a stray blank.
Missing values: columns with gaps get an extra <column>__missing_indicator column. In the example, you'd see income_band__missing_indicator.
Hardware: CUDA libraries not found means training is on CPU and will take longer.
Checking what the model learned
You can't look inside a TVAE model to see what it learned. The only way to check it is to generate data and compare it against the source. See Compare with the source.
When to retrain
Situation | Retrain? |
|---|---|
You changed an engine parameter | Yes |
You made columns active or inactive | Yes |
The source data has changed | Yes |
The model missed a relationship or distribution | Yes, with adjusted settings |
Values break a fixed rule (range, whole numbers, date order) | No, add a post-processing rule |
You want more or fewer rows | No, set the row count at generation |
5. Column Inclusion / Exclusion Guide
Every active column is something the model has to learn. Columns that carry no useful information slow training down, use more memory, and can make the output worse. Columns that give too much away can teach the model the wrong thing.
Exclude these
Unique identifiers. Primary keys, reference numbers and any other column with a different value in every row. The model can't learn a pattern from them. Worse, each value is treated as a separate category, which is the most common reason a run is slow or runs out of memory. Generate these with a generator function instead. Example: customer_id.
Columns calculated from another column. If one column is worked out from another, keep one of them. The model would otherwise have to learn the calculation, and will get it slightly wrong. Example: tenure_months is calculated from open_date, so open_date is inactive. If you need both, recalculate the second one with a post-processing rule.
Columns that give away another column's value. A column set directly from another column's value. For example, a status column that is set to DEFAULT whenever a default flag is 1. It adds nothing, and it can mask the real relationships.
Free text. Notes, comments and descriptions. TVAE treats each distinct text as a separate category, so it can't produce new text and may repeat real text. Mask or generate these separately.
Personal details. Names, emails, phone numbers and addresses. Excluding them keeps real personal details out of the model. Generate them with generator functions.
Include these
Columns with the patterns you want to keep. Any column involved in a relationship you care about must be active, on both sides of that relationship. Example: credit_score and credit_limit both stay active, so the model can learn that they rise together.
Columns with missing values. Keep them. The model learns where values are missing as well as what they are, and the pattern often carries information. Example: income_band is missing more often for BROKER customers. Keeping the column keeps that pattern.
Low-cardinality categories. Codes, bands and flags with a manageable number of values are what TVAE learns best.
Think before including these
Column type | Guidance |
|---|---|
Dates | TVAE learns dates, but not rules between them. Add |
Two columns that say nearly the same thing | For example, a balance and the same balance as a percentage. Keep one, and recalculate the other with a post-processing rule |
Categories with hundreds of values | Each value adds to memory and training time. Group rare values into an |
Foreign keys | Needed when you train related tables together, so child rows link to parents. Leave active in multi-table rule sets |
Columns filled by a generator function | Exclude from training. They're filled at generation time |
Quick checklist
Column | Active? | Why |
|---|---|---|
Primary key / unique ID | ✗ | No pattern to learn; slows training |
Foreign key (multi-table) | ✓ | Keeps parent–child links |
Category, code or band | ✓ | What TVAE learns best |
Number | ✓ | Unless calculated from another column |
Date | ✓ | Add date-order rules afterwards |
Calculated from another column | ✗ | Recalculate with a post-processing rule |
Gives away another column's value | ✗ | Adds nothing, masks real relationships |
Free text | ✗ | Can't be generated; may repeat real text |
Personal details | ✗ | Use generator functions |
Column with missing values | ✓ | The pattern of what's missing is information |
6. Generate and Validate
Generate data
1. Create a generation rule set. Select your trained model in its configuration.
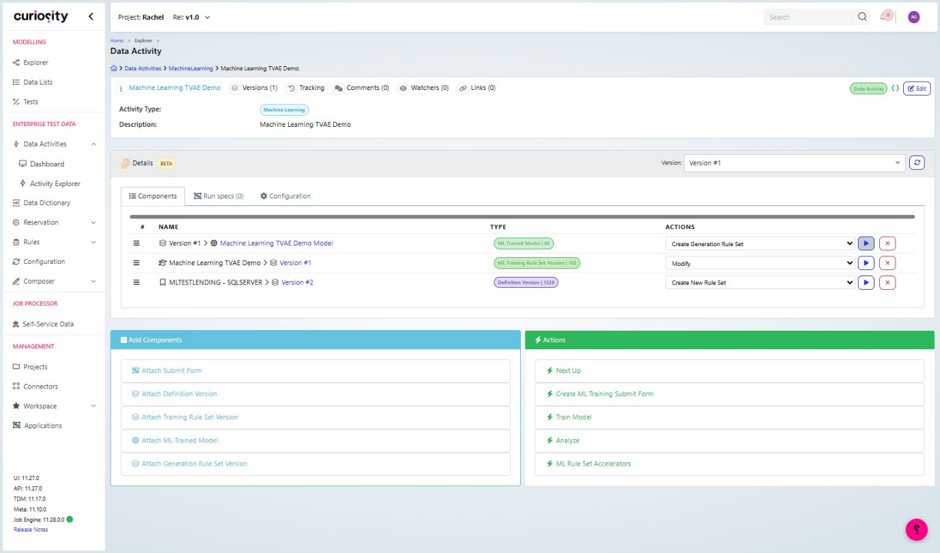
2. Review the rule set. For a first run you don't need to change anything. The table and column settings are copied from training. Leave post-processing rules out for now, so you can see what the model produces on its own.
3. Generate a small sample. Select Generate and enter a small row count, such as 500. Check that the job completes, the right columns are filled, and data types and formats are what you expect.
4. Generate a full run. Generate again with the same number of rows as your source table (12,000 in the example). Matching the row count makes the comparison fair. The job log shows the row count and where each output file was saved.
Compare with the source
Download the generated data from your host server and compare it with the source data. This shows whether the model has reproduced the patterns in the real data closely enough for your purpose, and where it falls short.
Compare on:
Distributions. Categories should appear in similar proportions. If 43% of source customers came through
BRANCH, expect about 43%. Numeric columns should have similar ranges, averages and shape.Rare values. Rare categories and extreme values should still appear, in roughly the same amounts.
Relationships. Columns that move together in the source should still move together. In the example, credit limit should still rise with credit score.
Missing values. Each column should have a similar share of missing values. About 7% of
income_bandvalues should be empty.Valid values. Every value should be possible: known categories, sensible ranges, and business rules that still hold.
Links between tables. If you generated more than one table, every child row should point to a real parent row, and each parent should have a similar number of children.
Similarity to real records. No synthetic row should be a copy of a real one.
Leave inactive columns and generator-filled columns out of the comparison.
What to expect: a close match, not an exact one. Proportions and missing-value rates are usually within a few percent of the source. Relationships between columns often come back a little weaker. Business rules are the most likely thing to break, because the model has no concept of a rule.
A small difference across many columns is normal. If one column or relationship is far off, improve the output as described below.
Improve the output
There are two ways to improve the output. You can use either or both.
Retrain the model if the model missed something, such as a weak relationship or a distorted distribution. See Tuning: which setting to change. Also check that the relevant columns were active.
Add post-processing rules to fix things the model can't be expected to learn, such as fixed ranges, whole numbers or date order. Rules are applied after the model has run, so you can add them and generate again without retraining. Rules run in the order they're listed, so put a rule that recalculates a value after any rules that fix its inputs.
Problem in the output | Rule |
|---|---|
Values outside the real range |
|
Decimals in whole-number columns |
|
Dates on weekends or holidays |
|
Dates in the wrong order |
|
Child rows pointing to parents that don't exist |
|
Parent totals that don't match their child rows |
|
Values that should be calculated from other columns |
|
Synthetic rows too similar to real ones |
|
For the example, Analyze suggests range_clipping on credit_score, credit_limit, tenure_months and dti_ratio, and integer_column_consistency on credit_score, credit_limit and tenure_months. These are a good starting set.
See Post-processing rules reference for all 25 rules and their settings.
Repeat until you're happy
Retrain and regenerate until the output meets your needs. Change one thing at a time and compare each run against the source, so you can see which change made the difference.