By combining data generation with the Modelling features of the Curiosity Platform, you can better ensure that you are creating all the test data that you require through visualising the different scenarios that your data need to to cover.
Steps to embed data generation in a model
Create a new model
This can be done by following the steps in the Quality Modeller 101 documentation.
Add a data generation activity to the model
Drag the Data generation activity from the side menu onto the canvas
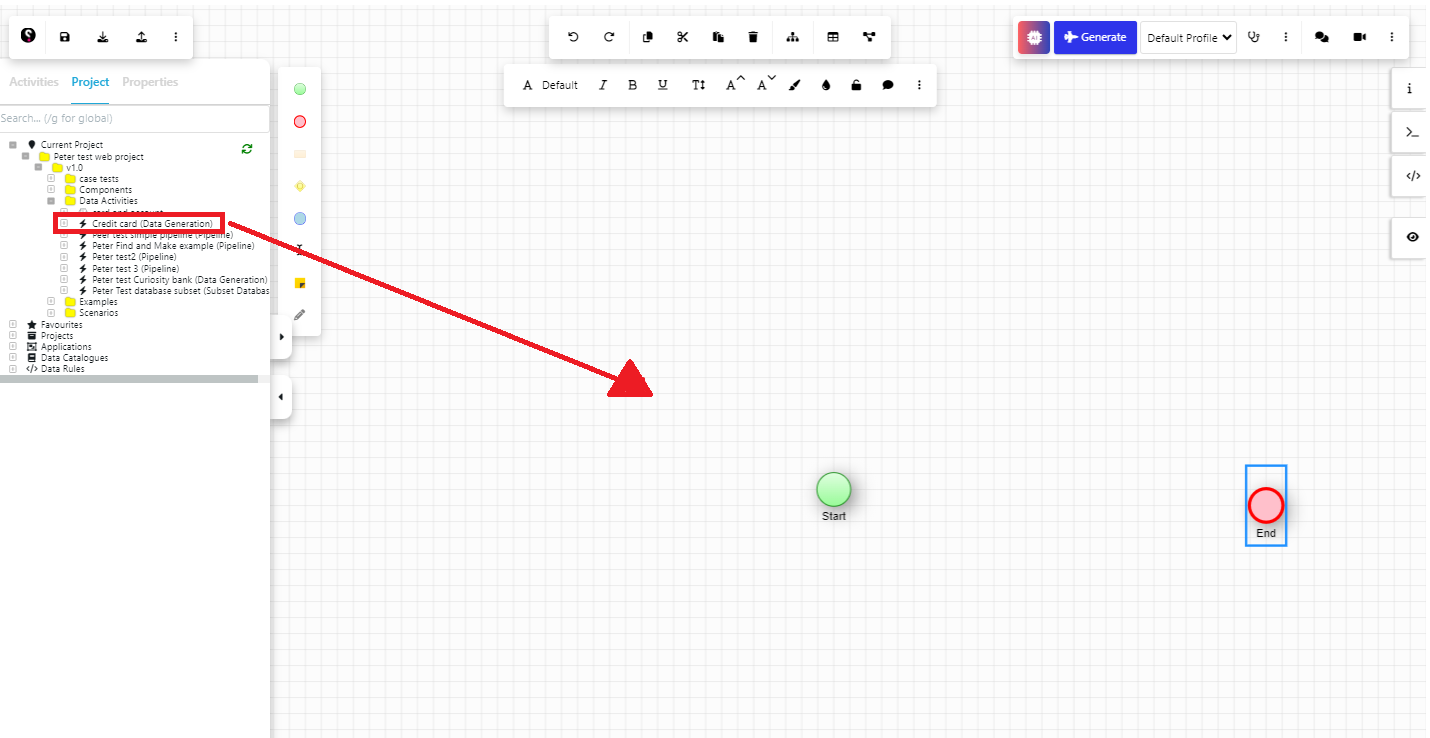
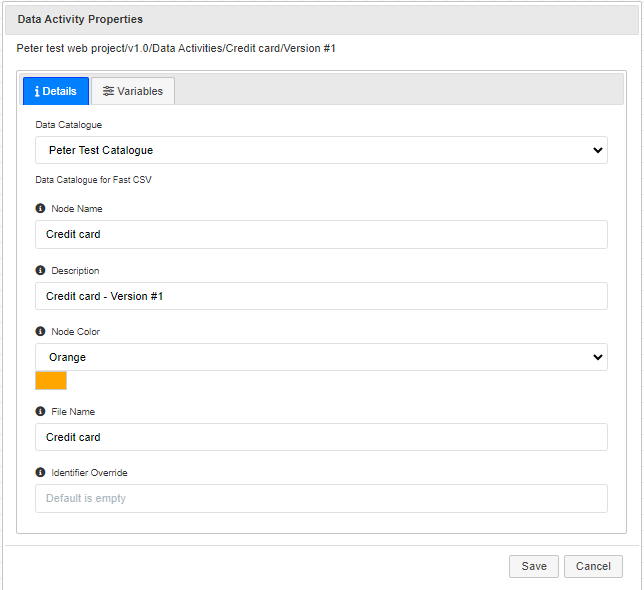
This will open the Data activities properties dialog. You can choose an appropriate Data Catalogue and click save.
This generates an initial model section, that you can link to the start and stop of the model

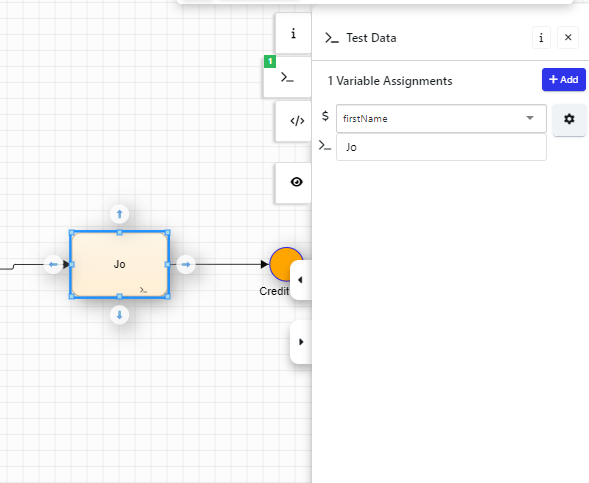
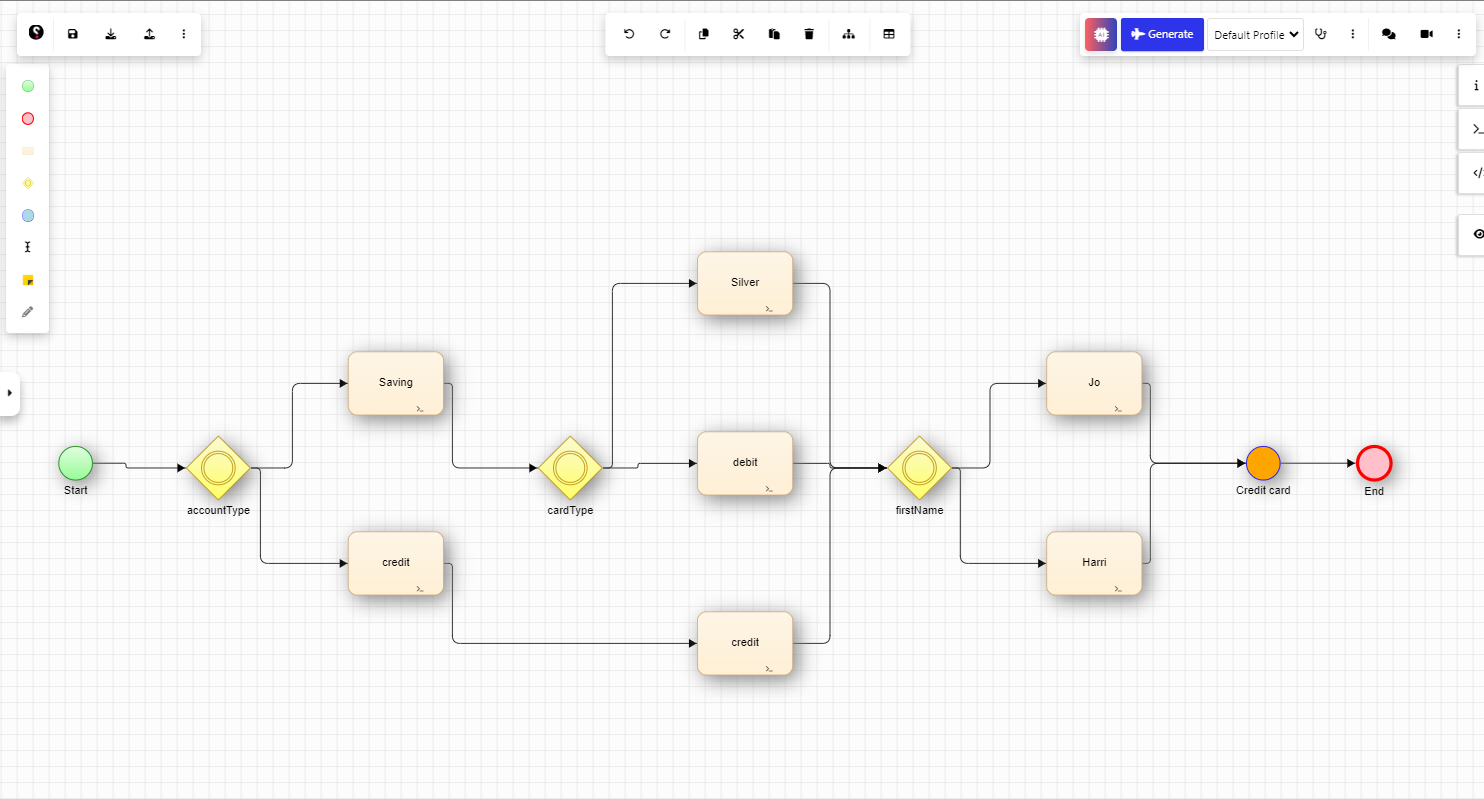
The values in each of the blocks reflects the values that were set up as defaults.
For example, the block called Jo, sets the firstName to ‘Jo’.
The Credit card element contains the automation that will add the data to the database when you execute the model.
Configure the model
You can add in additional paths that set the variables to other values. For example, below I have added some different possible values for my variables. Note that only a credit account can hold a credit card in this scenario.
Generate test data
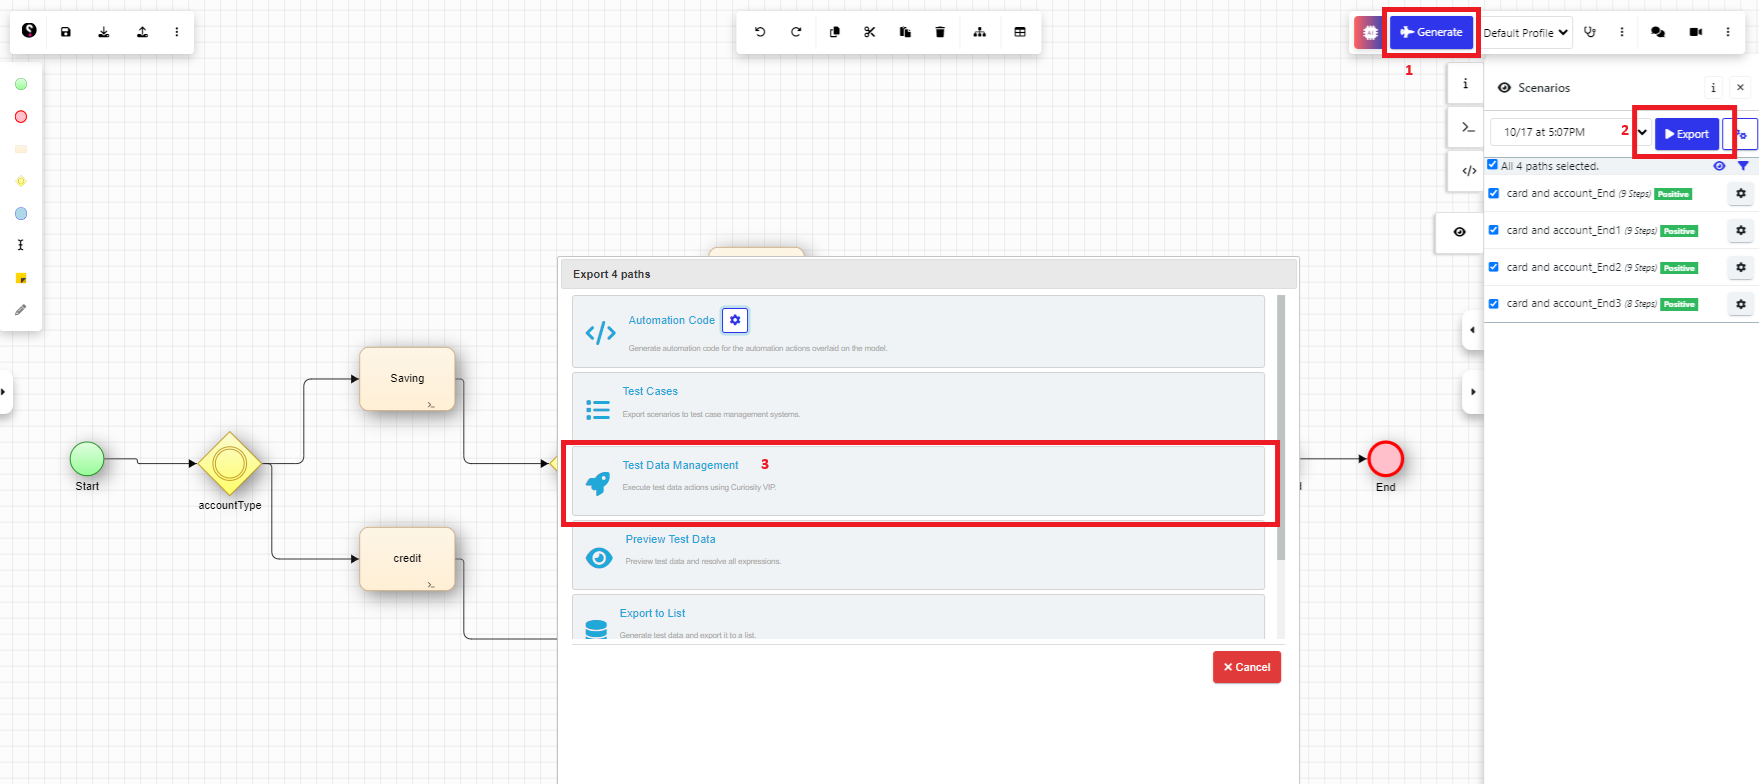
So the final step will be to click Generate (1) to create the data and insert it into the database, using the Export button (2) and choosing the Test Data Management option (3).
