Uncover how your data assets are interconnected.
Automatically map relationships between tables, fields, and systems.
A complete picture of how data flows through your organisation.
Getting Started
Navigate to the Data Dictionary and choose the object you wish to view. If you don’t have a registered object, please follow the Data Catalogue guide first. Click on your Object Name to proceed. In this example, the Name is Curiosity Bank.

The version, schema and any actions you can take will be provide.
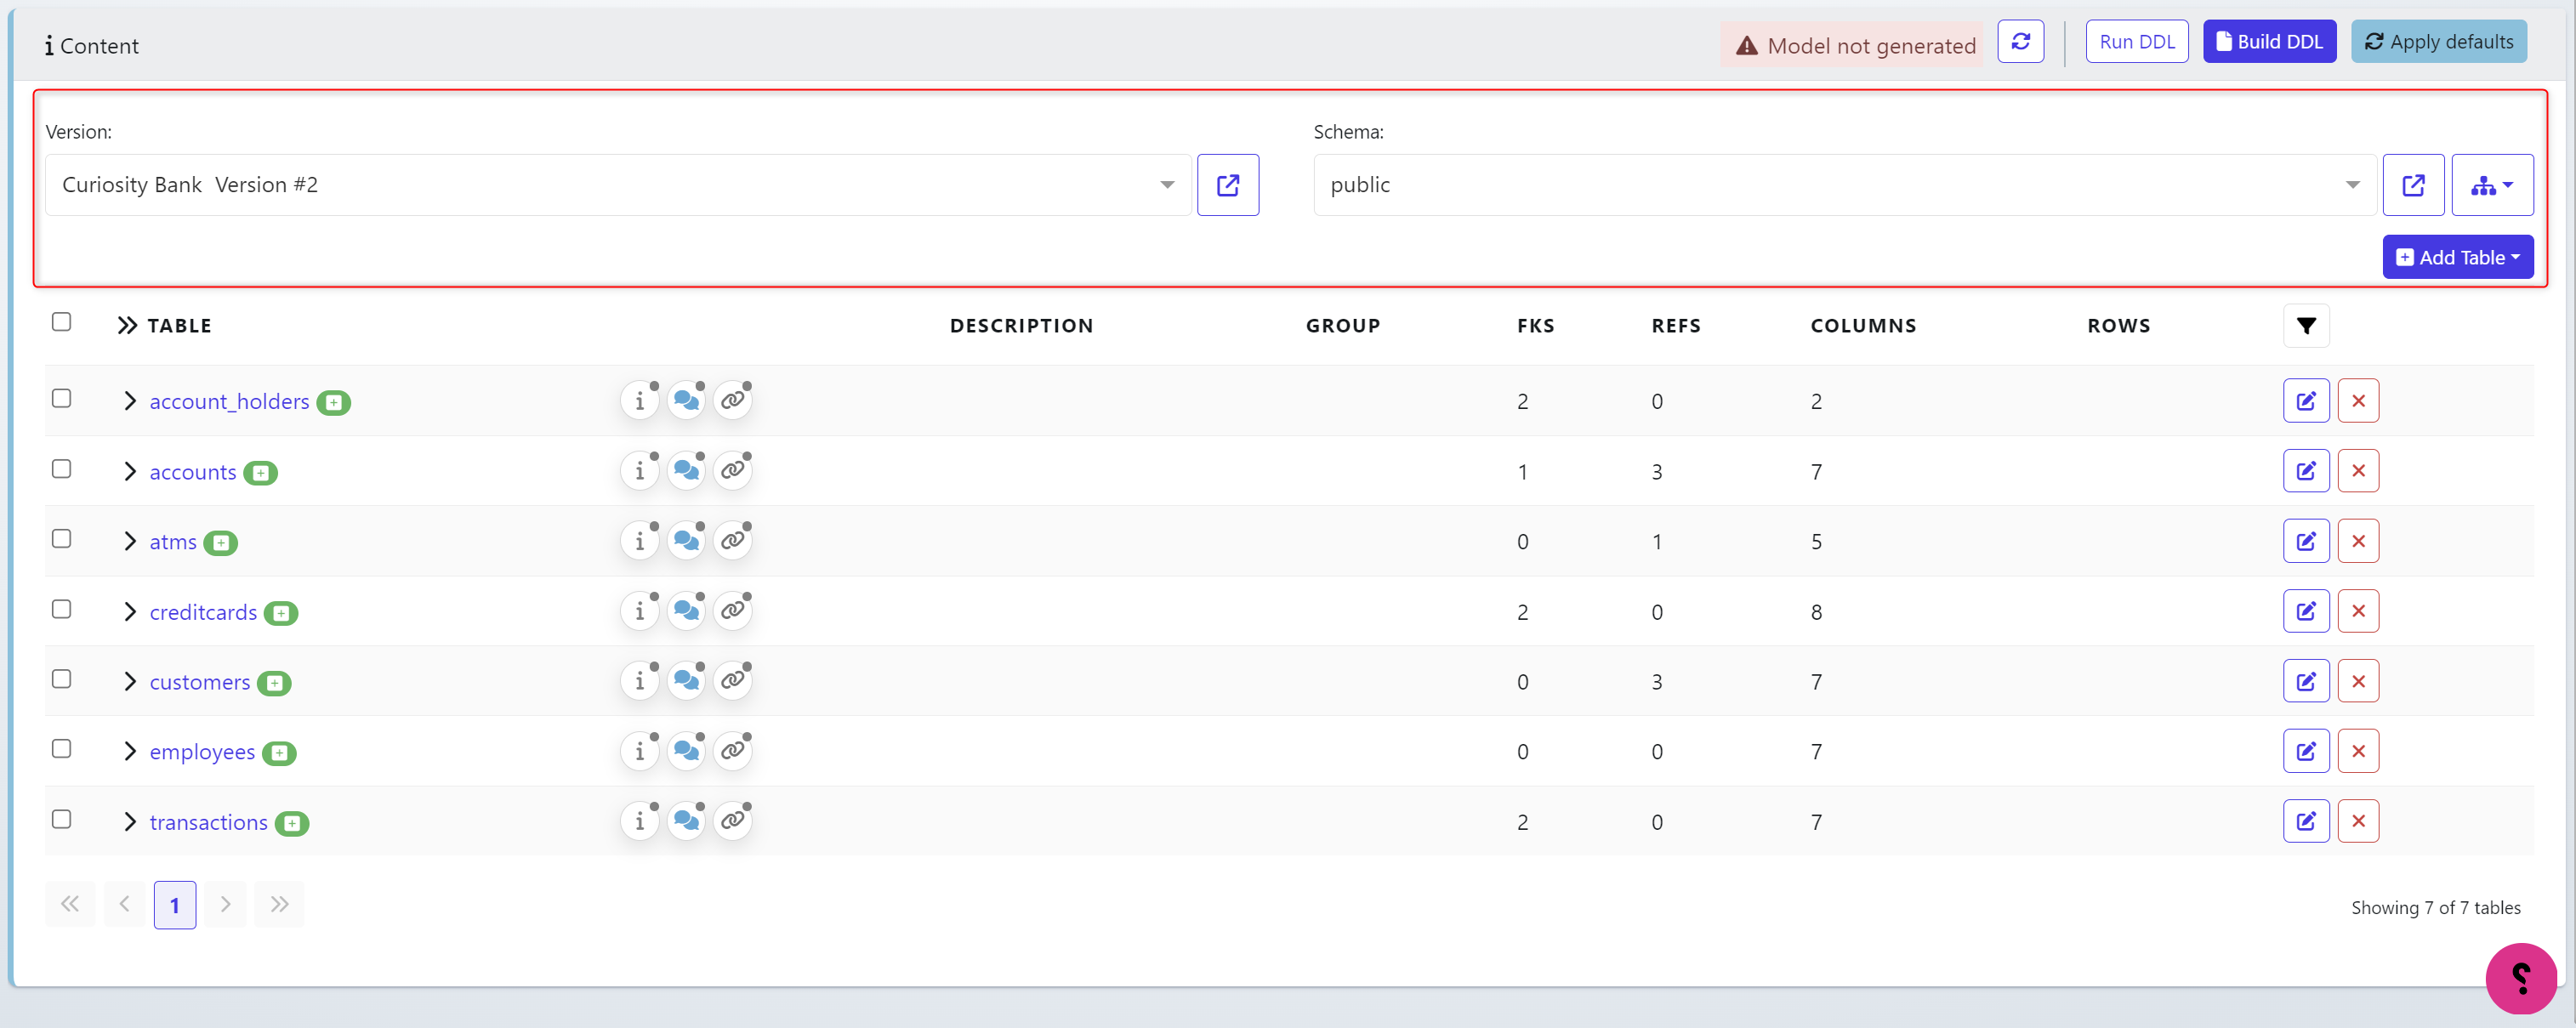
The table names and additional meta data (Foreign Keys, References, Column information) will be stored below.
Entity Diagrams
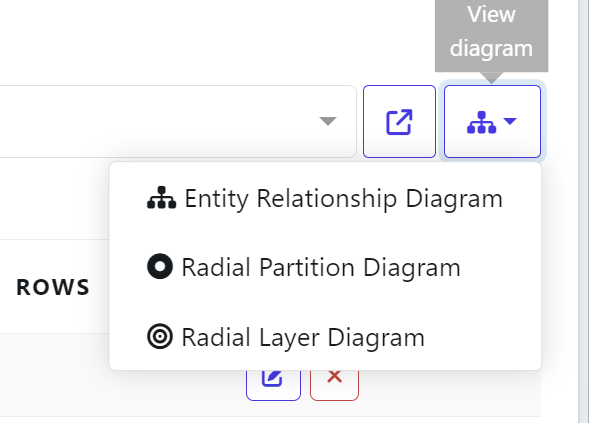
Click the ‘Diagram’ Icon in the top right and choose Entity Relationship Diagram
This will present the existing found relationships that need to be considered and likely maintained when running a masking routine.
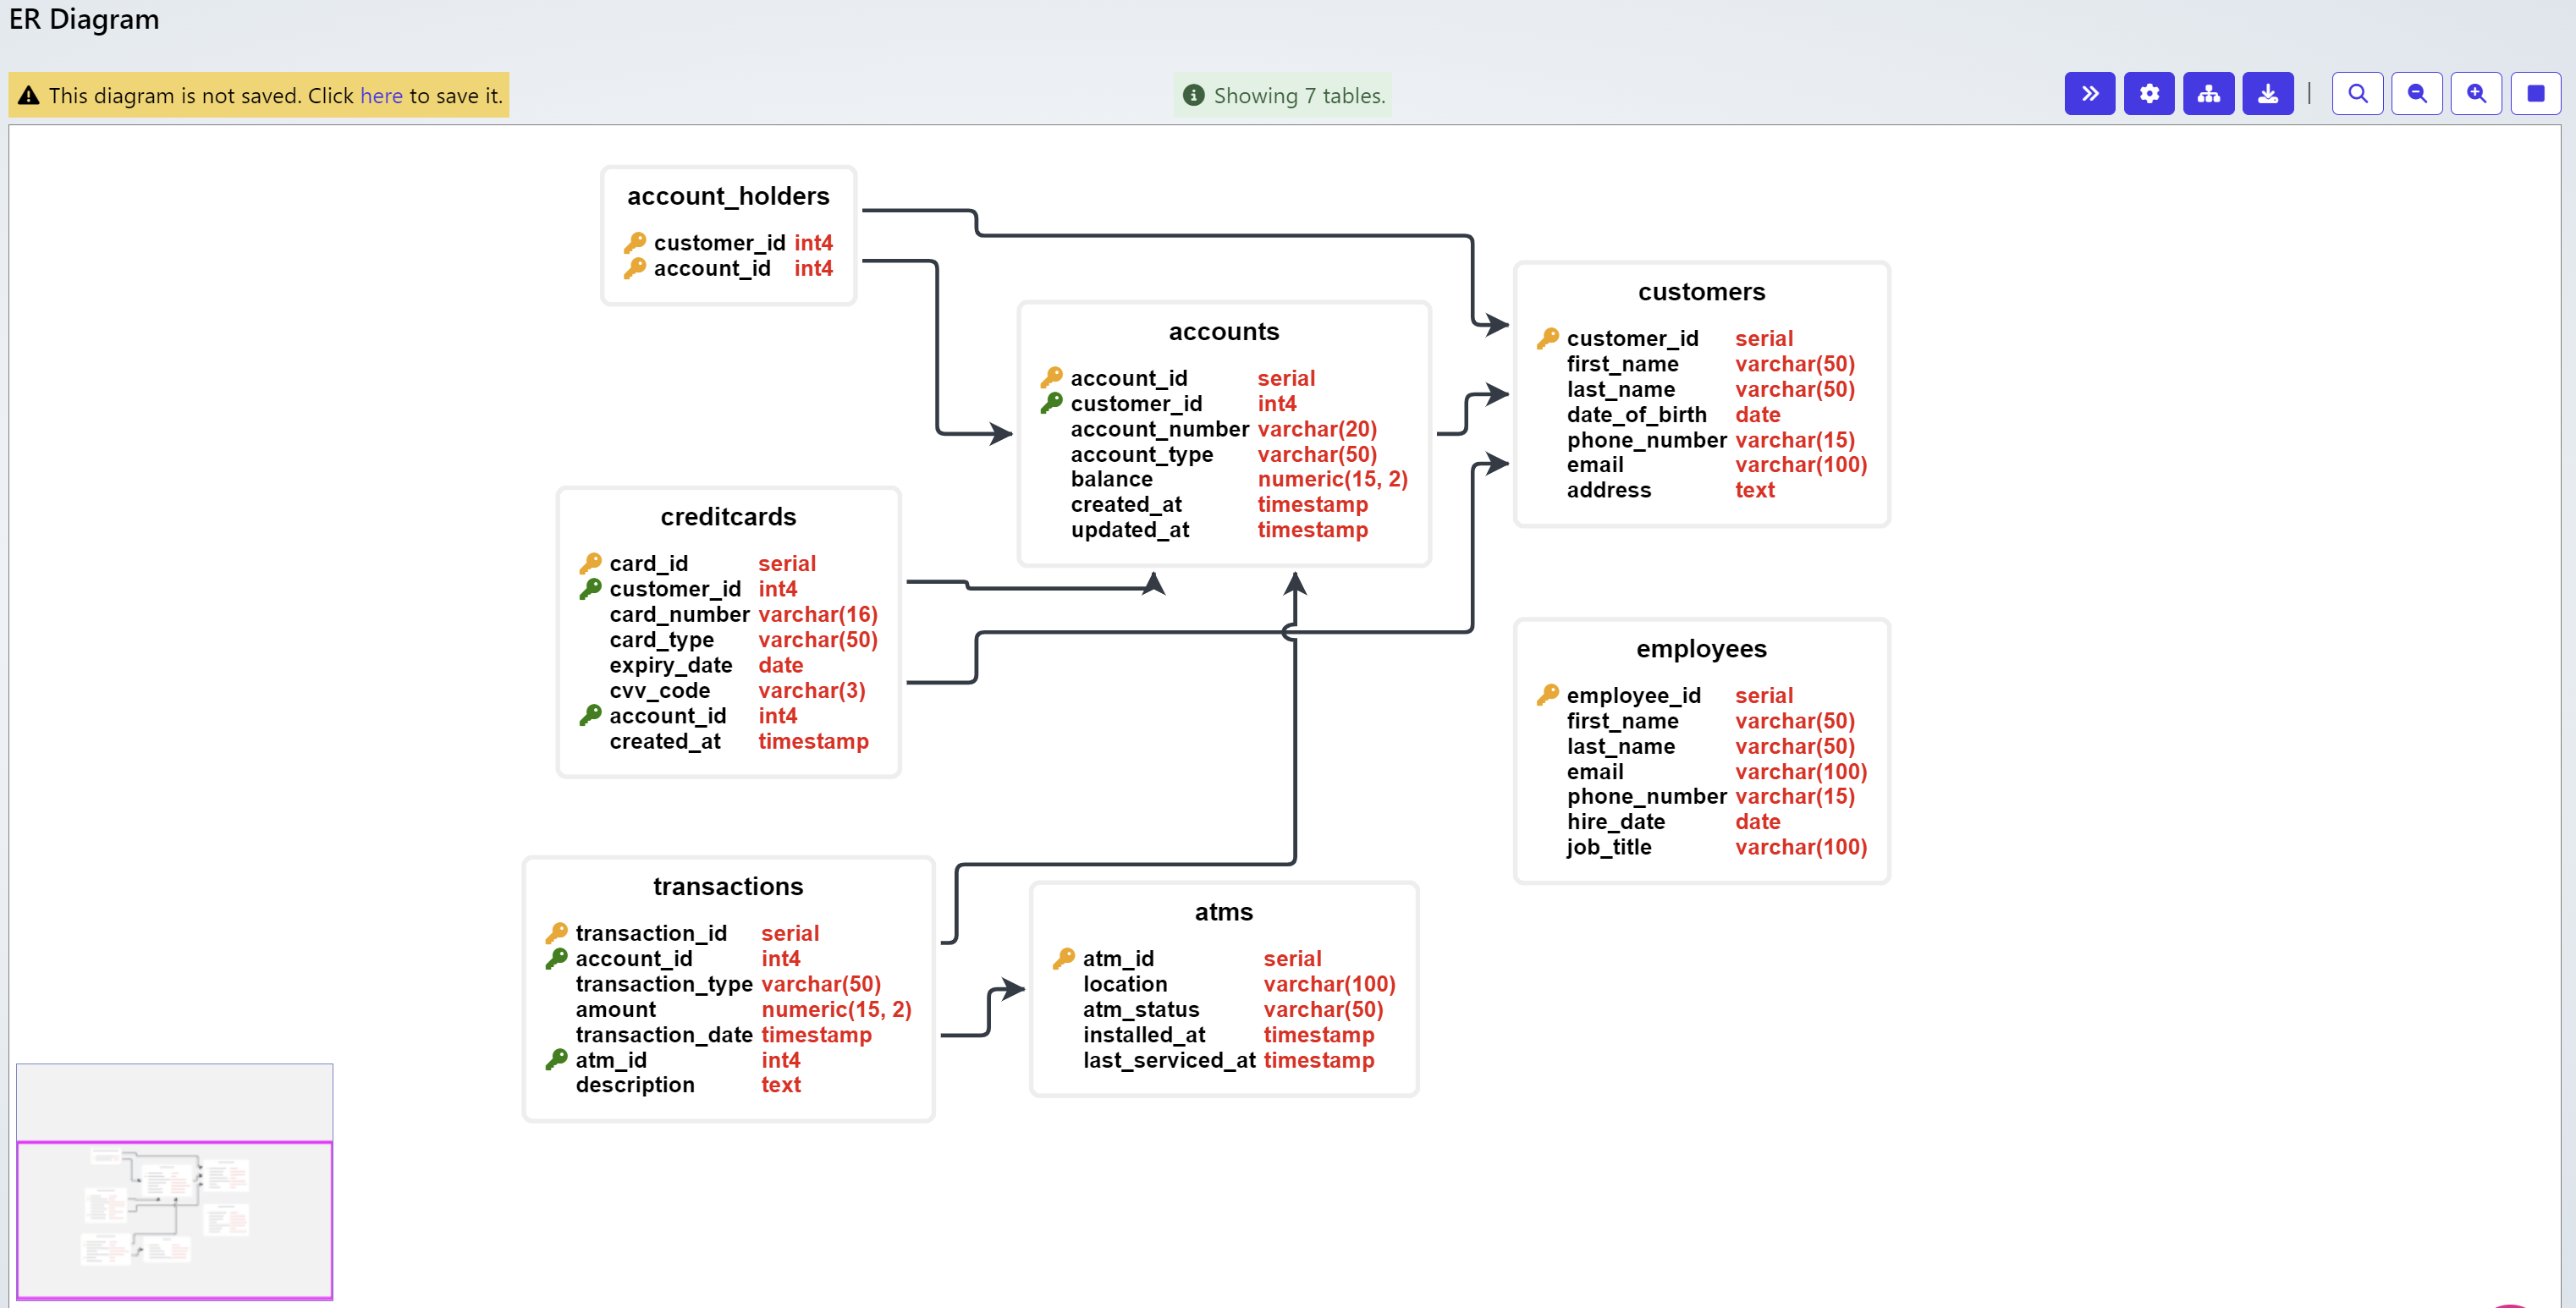
In the top right, additional actions are possible including:

Toggle Collapse/Expand the image
Settings
Relayout
Download as PNG
Search
Zoom In / Out
Fit to screen
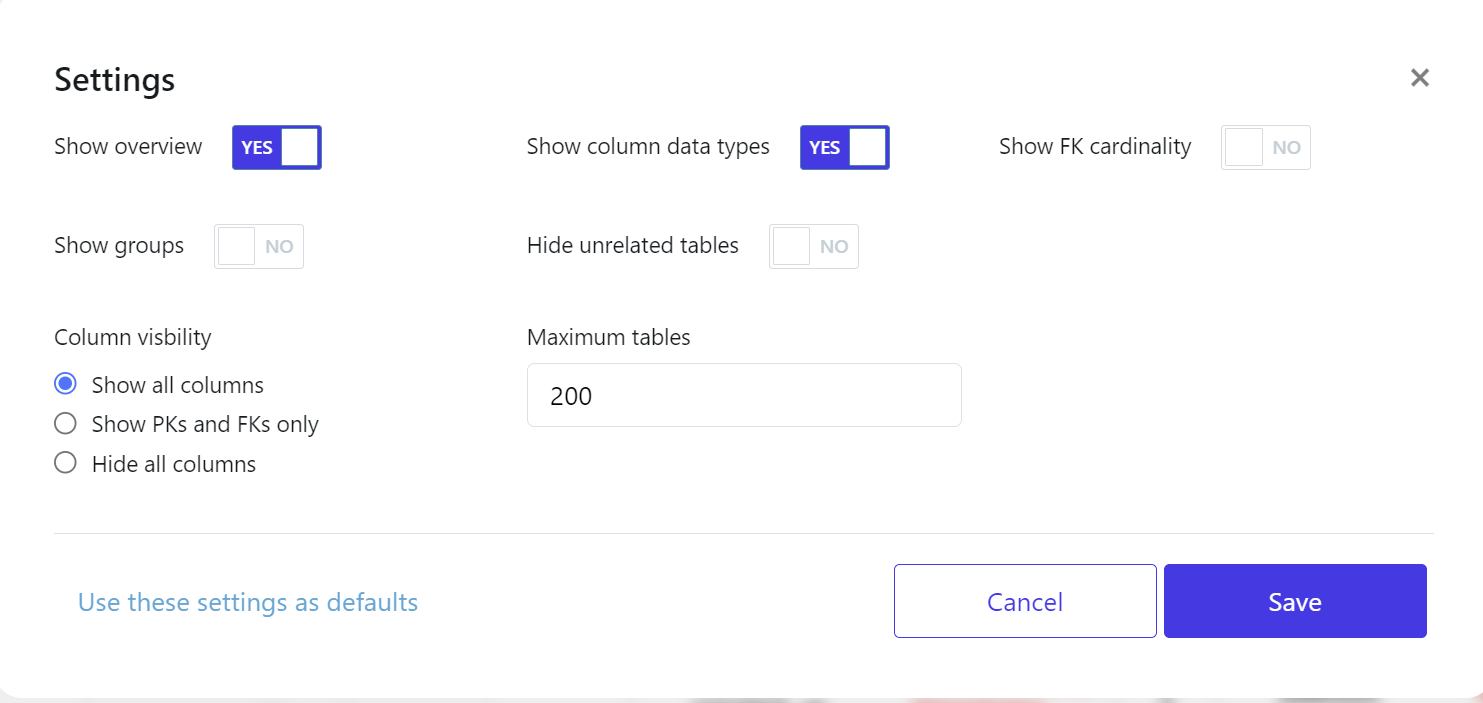
Settings
Some databases & files have large structures and table amounts/column amounts. Settings allow you to customize what is displayed and how much based on various configurations. The amount of tables displayed and the columns you wish to see, should be configured here for an easier viewing experience when looking at large databases.
Diagrams
There are 3 diagrams you could user:
Entity Relationship Diagram
Radial Partition Diagram
Radial Layer Diagram
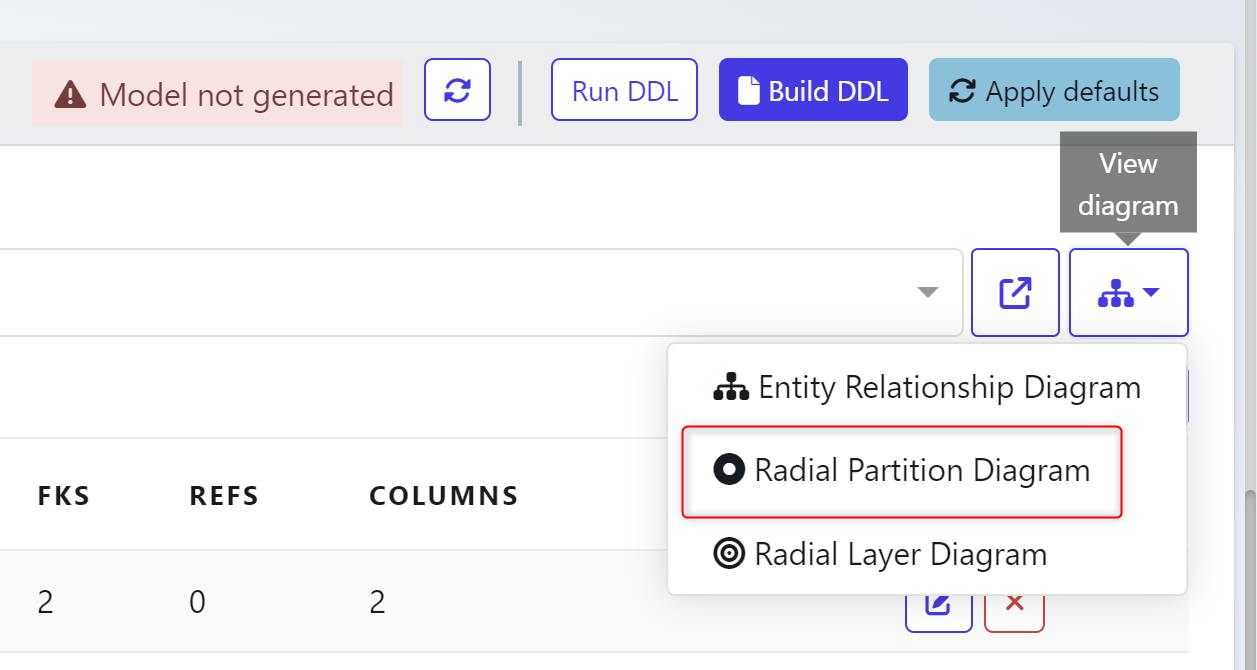
Click on Radial Partition Diagram
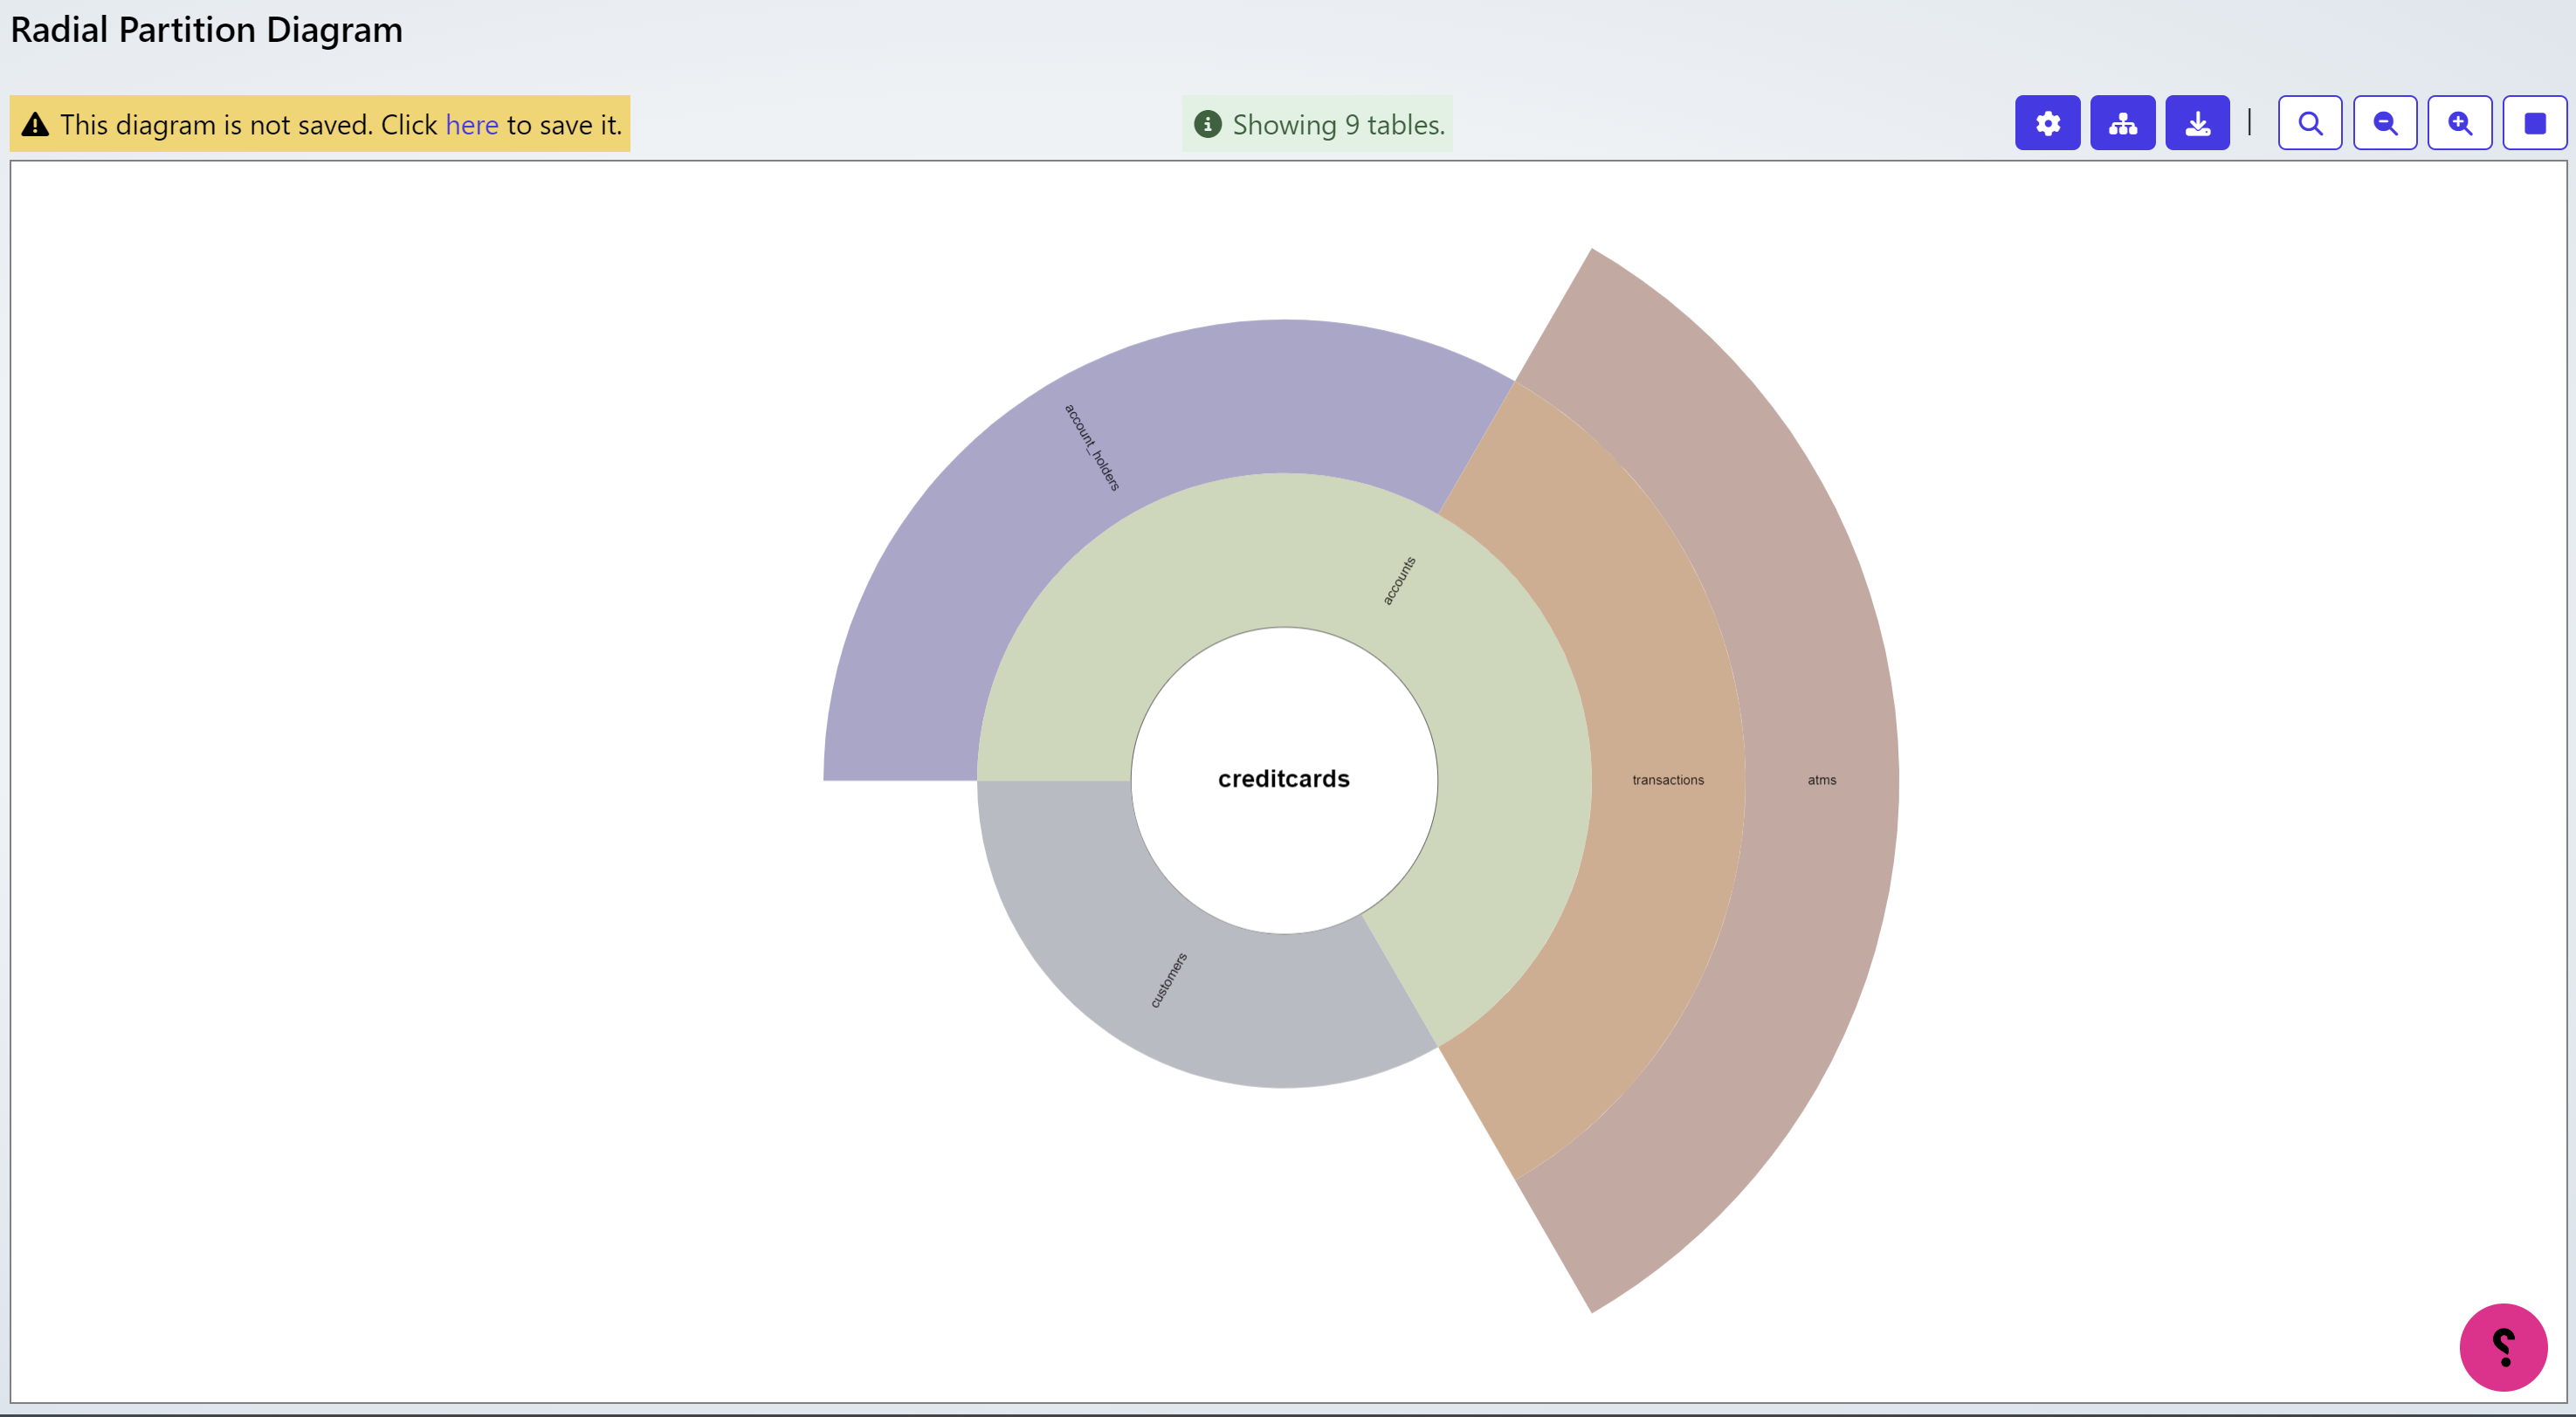
By hovering over each table the relationship detail will be provided.
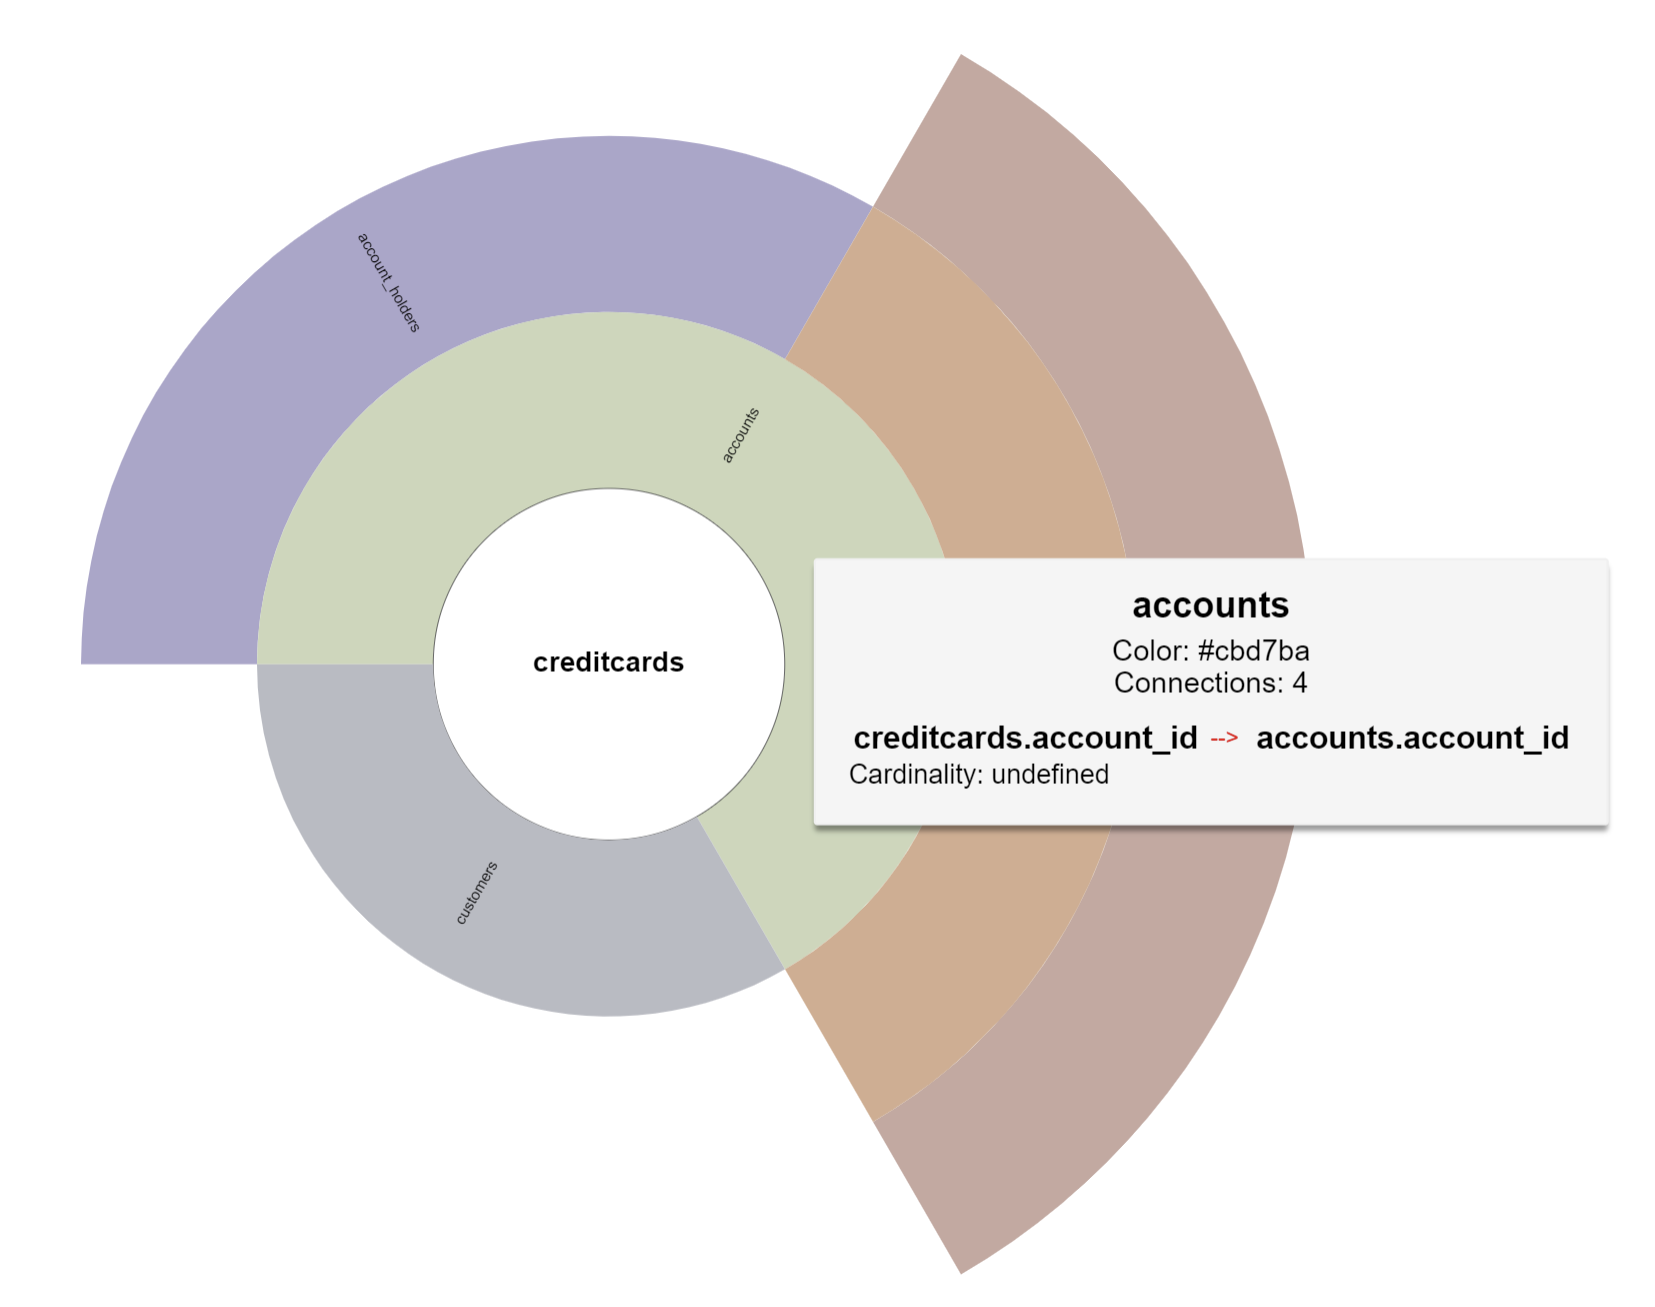
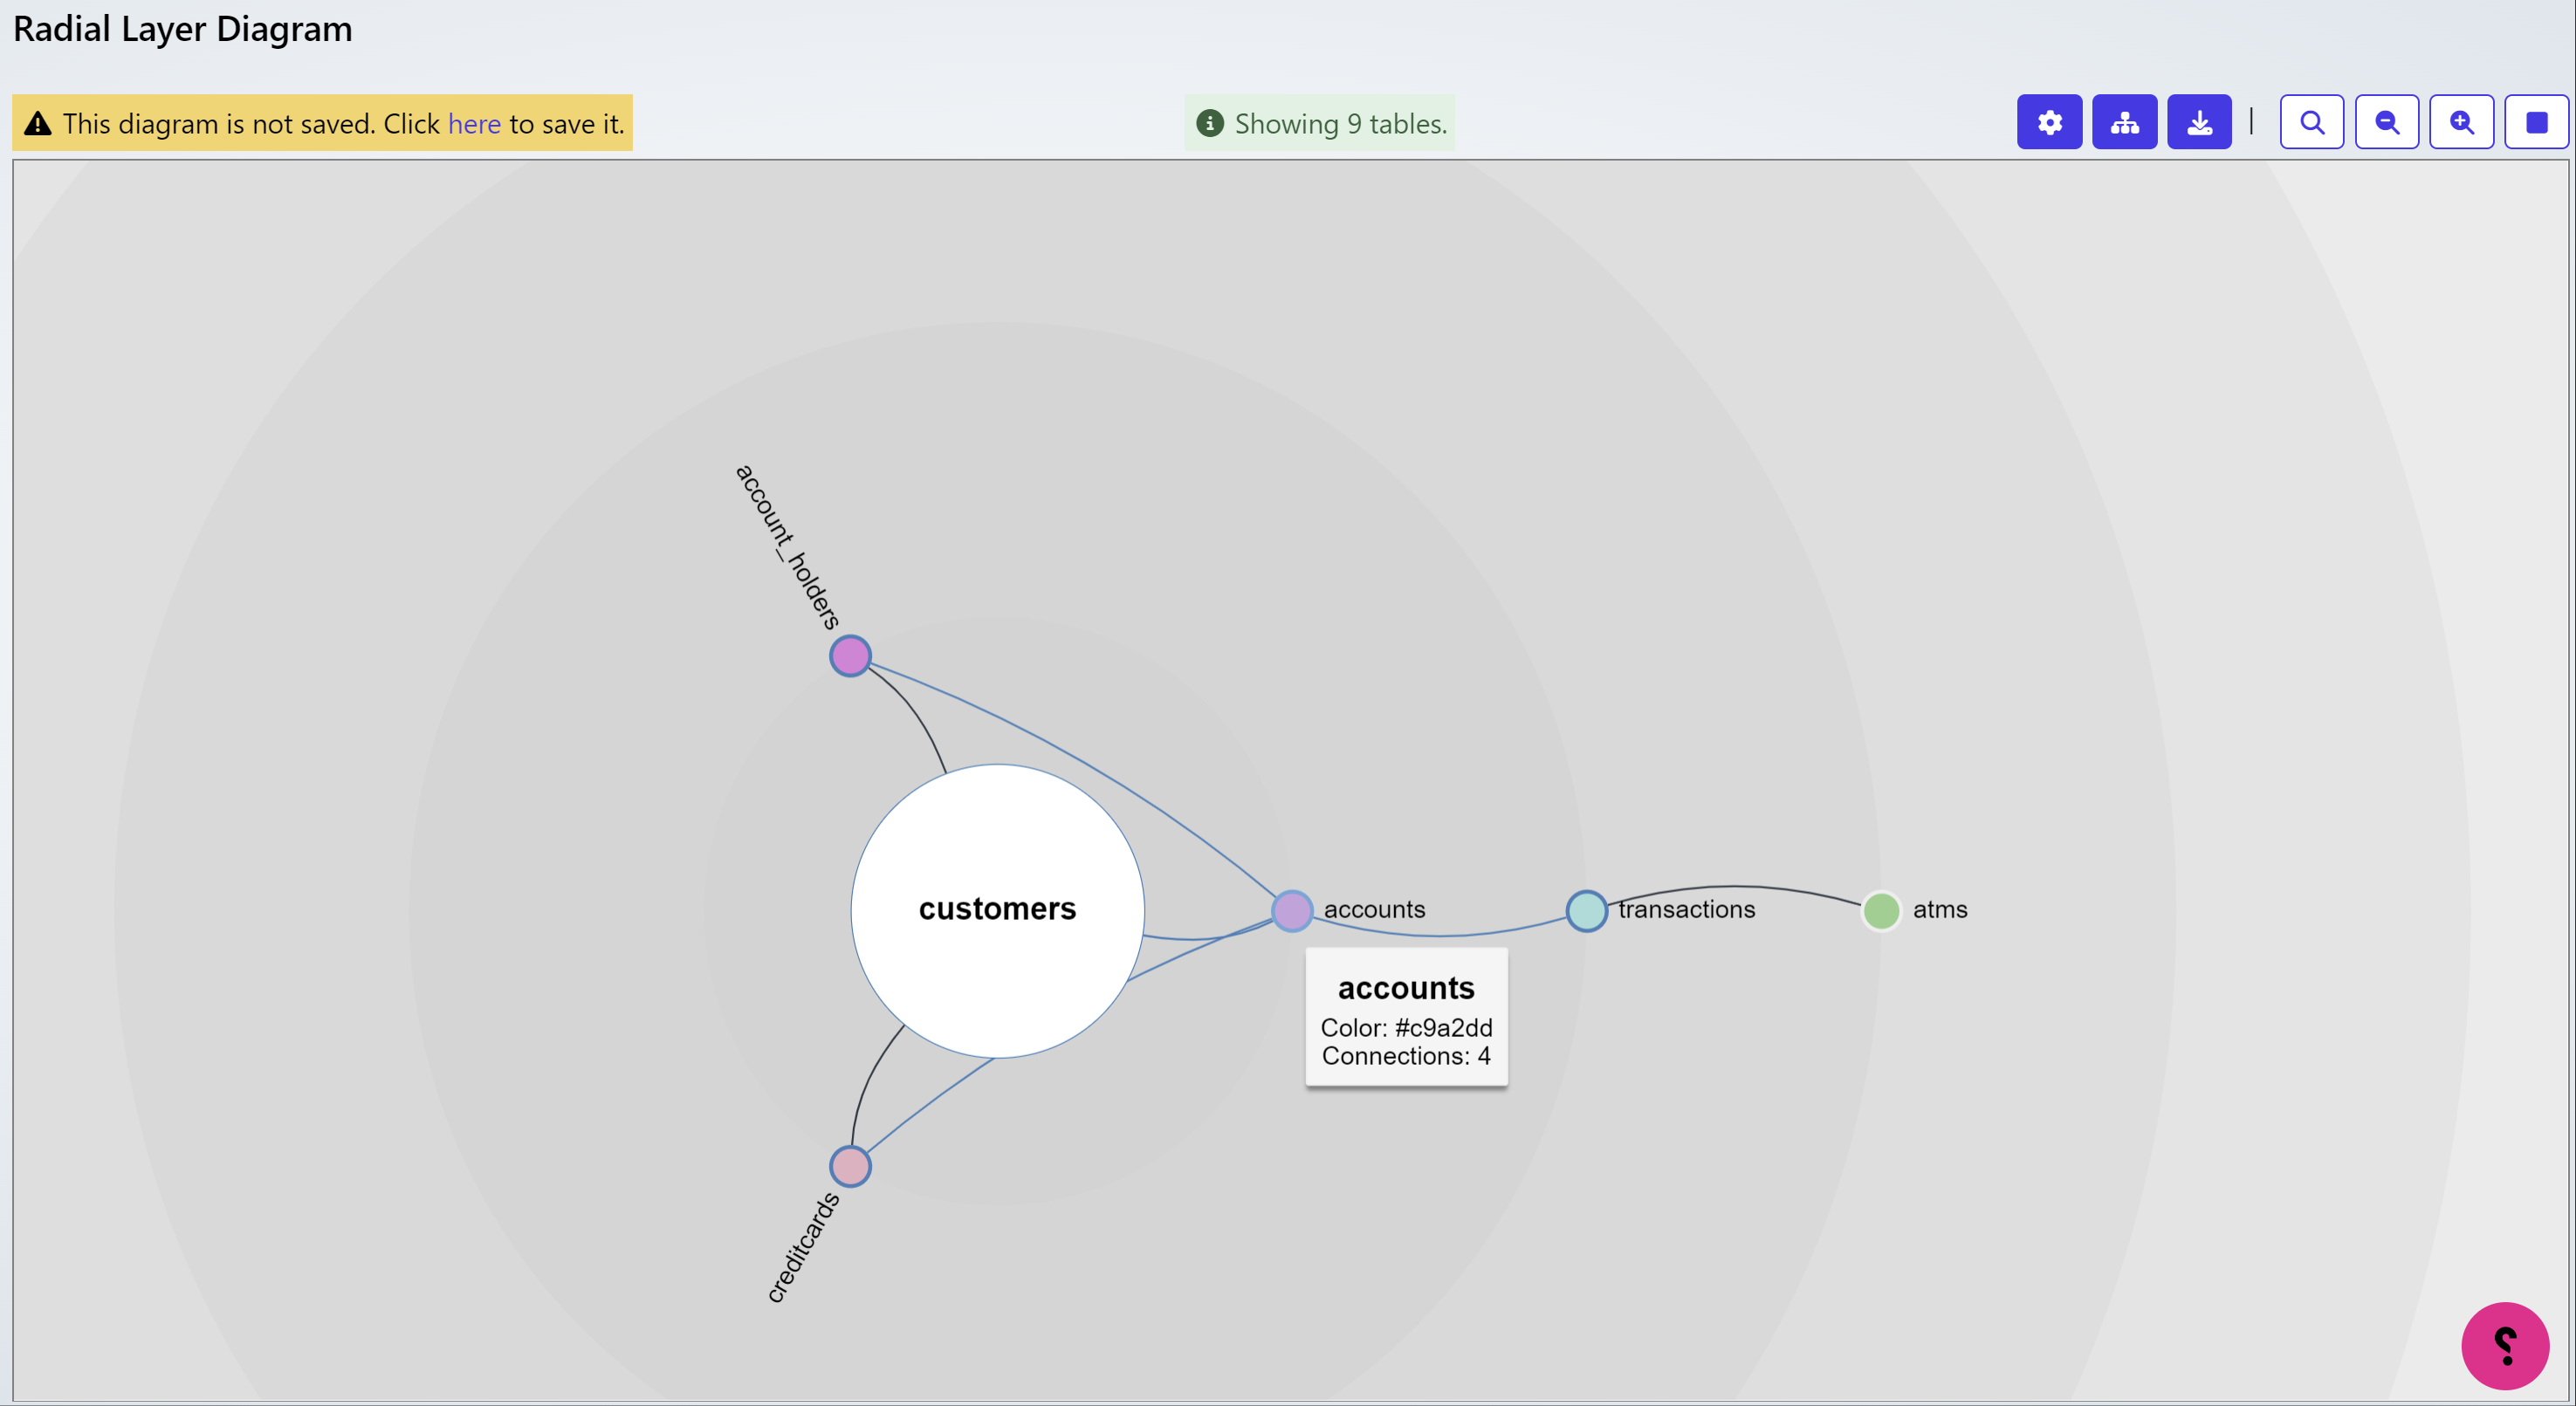
If you select Radial Layer Diagram it will display the table relationships. If you hover over each of the tables it will display the Connections from table to table.
