This page shows the Test Data Activity for Data Probability Analysis, a technique to analyse and discover relationships in data. In this tutorial, you'll learn how to set-up and configurate the Synthetic Data Generation Activity.
About
The Data Probability Analysis Activity is an exploration tool that analyses data sets for different combinations of values. The result is useful for identifying patterns which exist in your data. The activity uses Apriori machine learning to discover relationships. The scan will look for potential relationships between data states to see which combinations occur together, and do not occur together - indicating the potential presence of business logic. The probability analysis result can then be used to validate additional data sets, along with as an input to generate synthetic data.
Tutorial
Follow along with the video tutorial, or read the written tutorial below where each of the data probability analysis steps is broken down and explained.
Prerequisites for Data Probability Analysis
For this data activity, you will need a:
- A CSV file of the dataset to be analysed. We recommend exporting your data to CSV format.
Step 1 - Create Probability Analysis Activity
The first step to scanning your data, is to create a new data probability analysis activity. Firstly, navigate to the Data Activities dashboard, then select the 'Data Probability Analysis' activity.

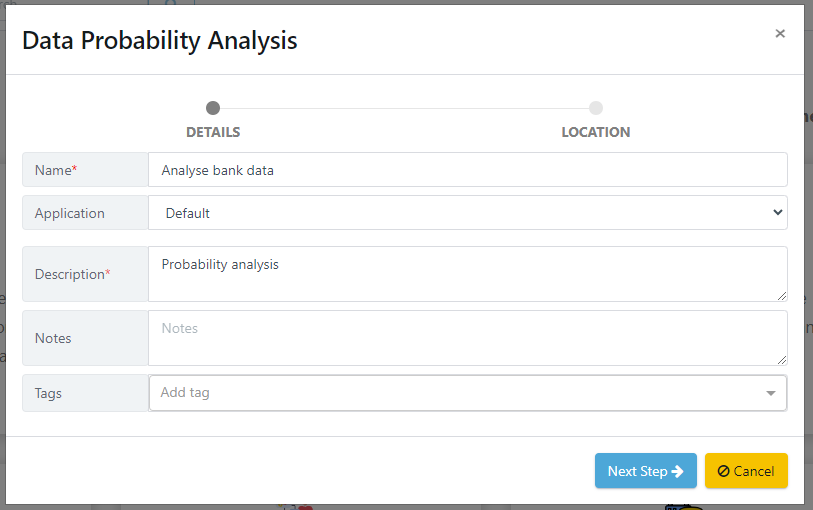
This will launch the wizard for creating data activities. In this section, you are required to provide specific details about the activity, including a mandatory name and description. After filling out the necessary information, click on the 'Next' button to proceed.
After entering the activity details, you must select a location to save the data activity. Once you have chosen a location, click the 'Finish' button to complete the wizard.
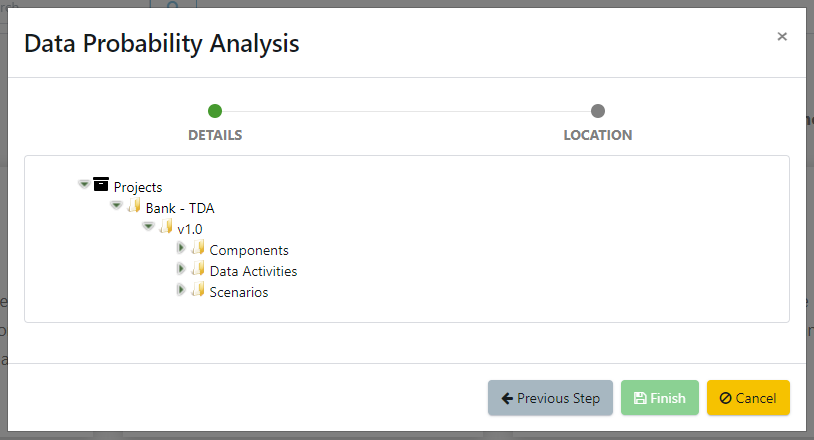
A new data activity will appear, ready for configuration.
Step 2 - Probability Analysis Configuration
When a Probability Analysis activity is created, a default configuration will be set. These specify different settings within the data activity. You will want to edit these default configurations to suit your needs. To do this, click the edit button in the top right hand corner.
To begin, we will first set our property parameters in the configurations section. Click the Edit button to open the configurations tab.

The following property parameters can be configured to suit your needs:
| Group Count | This is the number of columns to analyze for a match. For example, inputting a value of “2-5” will perform a range from 2 to 5. A value of “2,3” will perform an analysis on columns 2 and 3. |
| Limit to Items | This value will restrict the analysis to a specific value, for example “CustomerType=Retail” |
| How many to analyze | This refers to how many rows to process in the dataset. |
| Must-occur confidence limit | If the analyzed probability is above this value, it will provide a value of “Must Occur” for the relationship. |
| Report the full analysis | The final report will show all potential relationships if the value is True. A False value will only show the most likely relationships. By default, this is set to false. |
| Columns to analyze | This value will determine how many columns at the front of the dataset will be processed. When left empty, all columns will be analyzed. A rule set can alternatively be used to select the columns to be analyzed. |
| Max time to run | The maximum time to run the analysis in seconds |
Step 3 - Upload CSV file
Now that we have finished inputting our properties, we can begin our data probability analysis. You will need a CSV file to upload into TDA. Under the actions sections, we will select Upload File to be analyzed to Server. Select the input field and upload it to the activity.

Step 4 - Run Data Probability Analysis
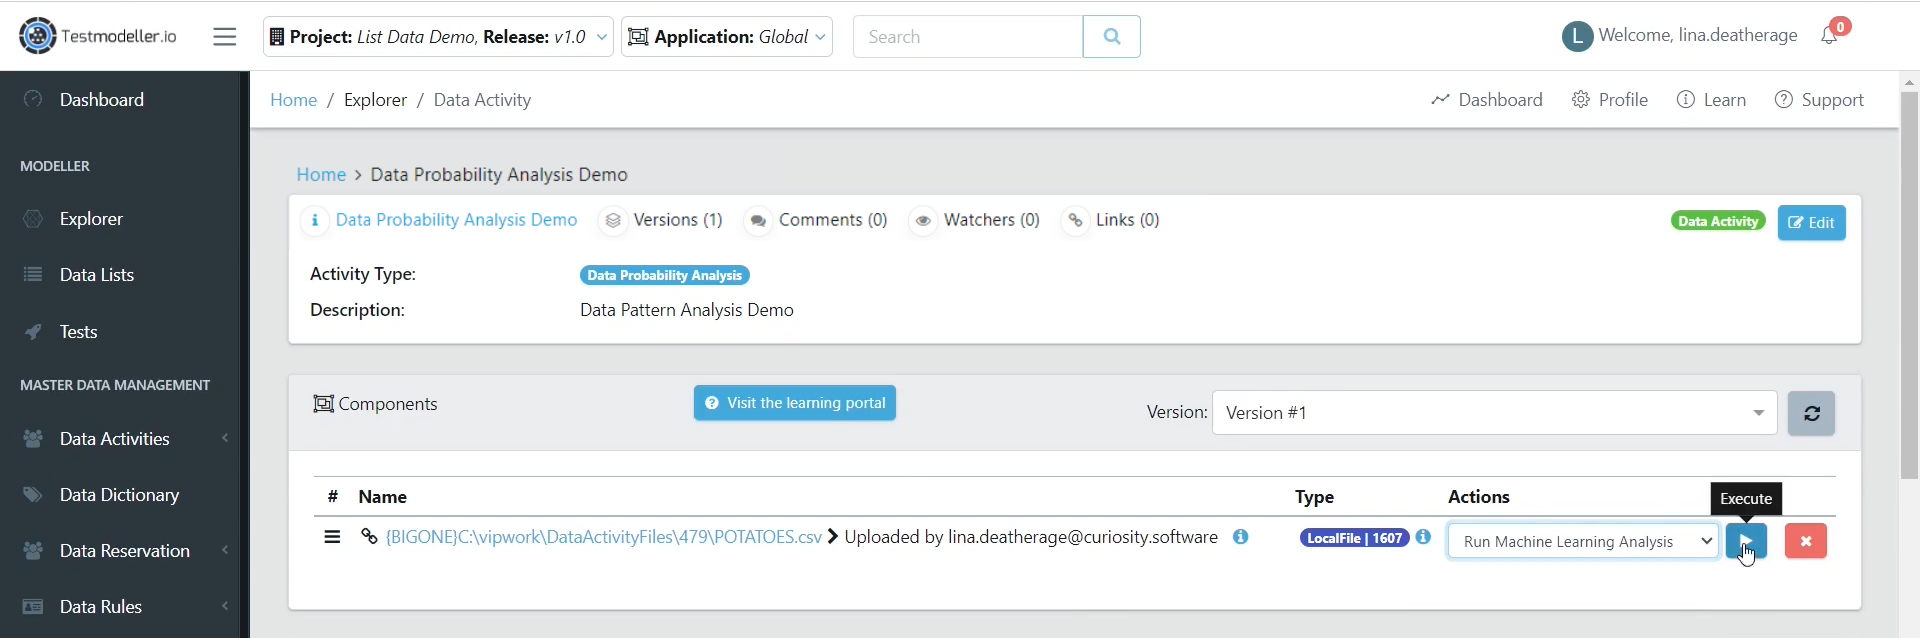
When the file has been uploaded, it will now show in the Components section.
From here, we can execute our analysis. Click run, and then select your server to begin the job.
Step 5 - Review Results
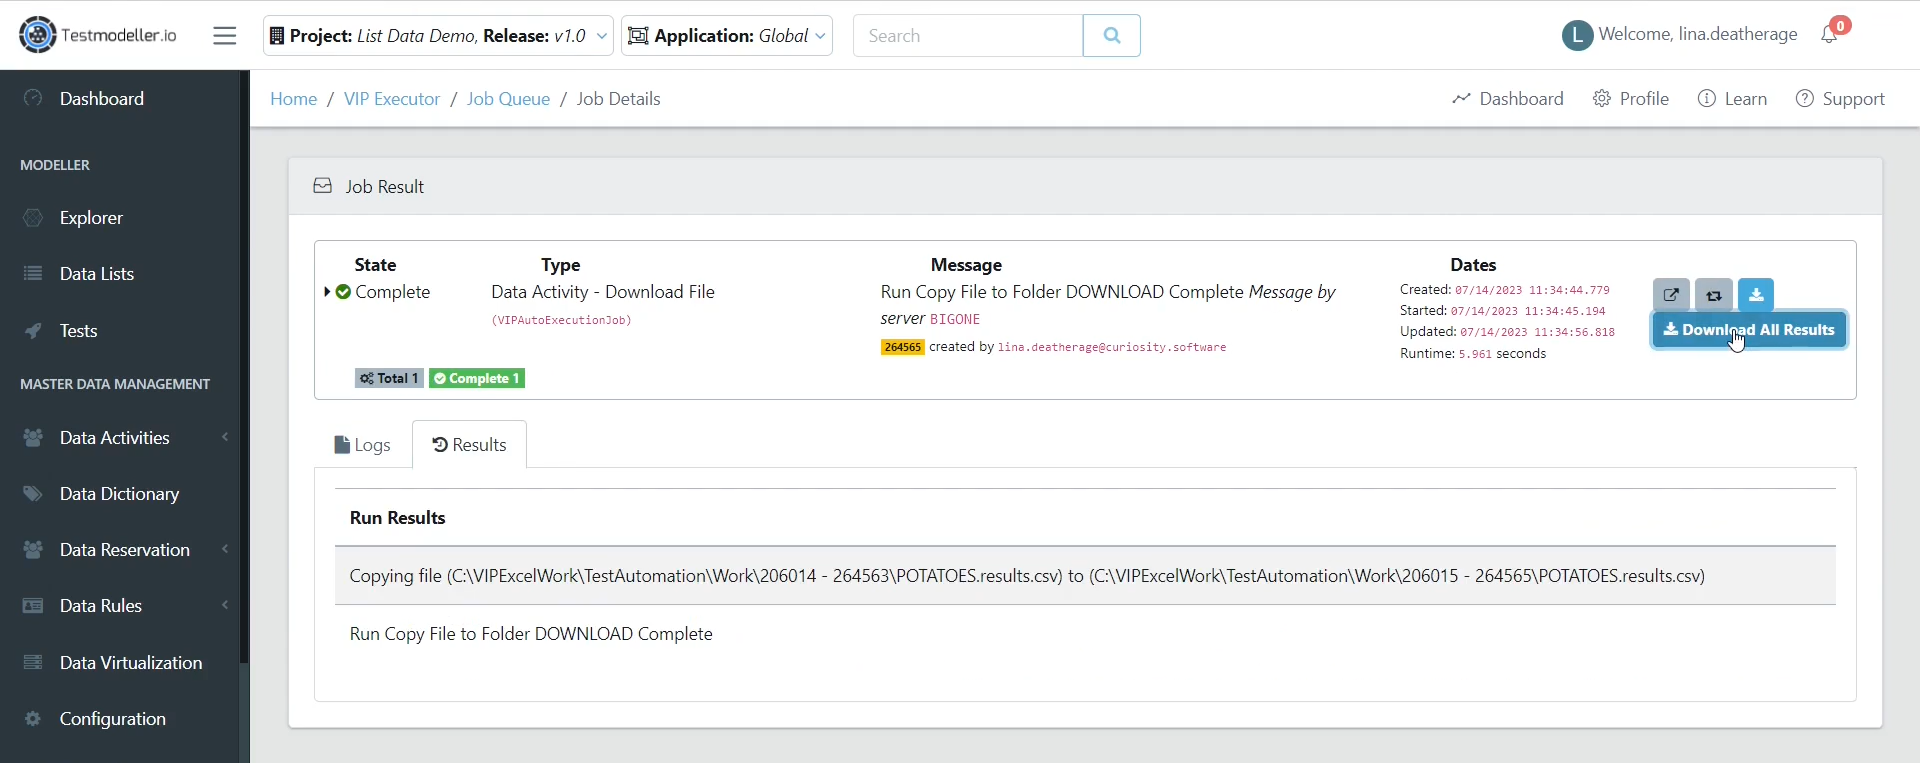
Once the job has finished, there will be a new component that contains the results in a new CSV. Select the download action from the dropdown to download the file.
.png)
This will process the Download request and provide an option to download a zip folder with your new report.
The CSV contains the following analysis in the first 4 columns:
| Probability | this is the probability that this relationship occurs in the dataset. |
| Frequency | this value refers to how many times the n selected columns occur together in the data set. The Must Occur value is evaluated based on this field. |
| Combination Search | this value is based on what is specified when generating a paired set. |
| Possible Rule | shows the relationship we’ve discovered in our data, based on the confidence limit we configured. |
Here is an example of a final CSV report:
