The diagrams in Enterprise Test Data are used to provide graphical represents of data definitions, and data. There are three possible diagrams that each help you understand the content and relationships.
1. Entity Relationship Diagram
An Entity-Relationship Diagram (ERD) is a type of diagram that illustrates how entities in a database relate to each other. In the context of databases, an "entity" usually represents a table, and the relationships between entities illustrate how tables interact with one another.
Begin in the Definition Structure Details pane for the definition you want to work with, by clicking on Data Dictionary in the Master Data Management section of the Navigation Panel. Then select the Definitions Structure tab and select your definition.
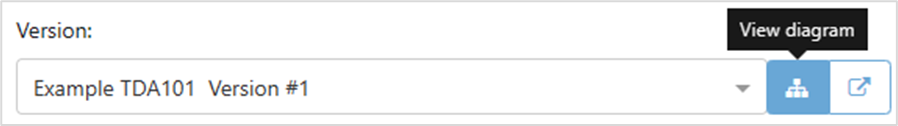
You can display an entity relationship diagram for the whole definition by clicking on the View Diagram button next to the Version dropdown selector.
The benefit of this method is that it is a single click to display the diagram, however database structures can become large and complex, and generating a diagram of the whole structure may not be helpful. If this becomes a problem, use the Diagram Builder.
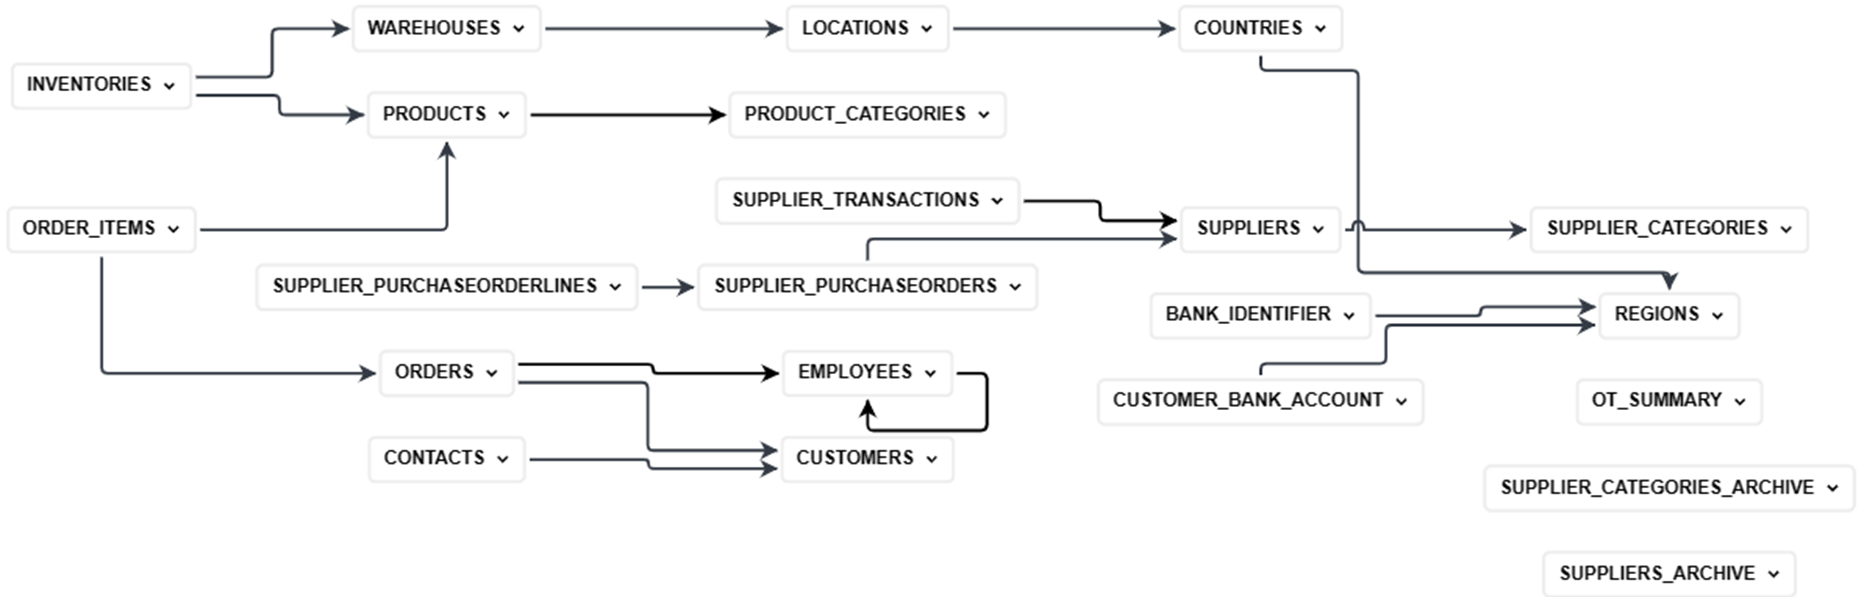
Diagram Builder
Diagram Builder is a utility that lets you select the tables you want to display in your diagram, making them less unwieldy and more targeted and helpful. Diagram Builder can display the relationships between tables in one of three formats:
Entity Relationship Diagram | Radial Partition Diagram | Radial Layer Diagram |
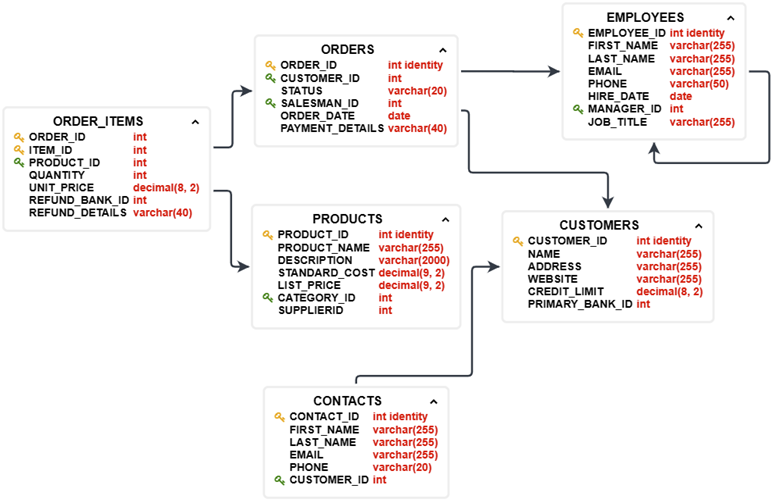 | 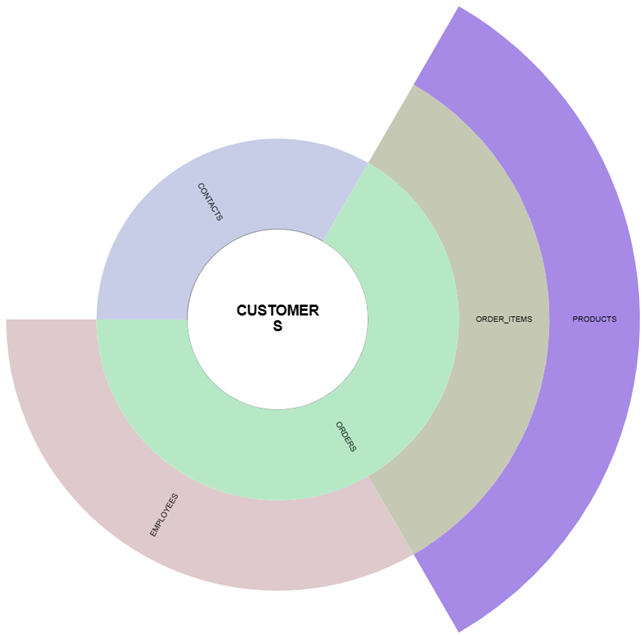 |  |
The Entity relationship diagrams gives the most and detailed graphical display of your database structure. | The Radial Partition Diagram shows the degrees of separation between a selected database and the others it is related to: it helps you understand how tables relate and how many steps there are between tables. | Like the radial partition diagram, the Radial Layer Diagram can show the degrees of separation between tables, however, the lines show the relationships between the tables. |
How to use the Diagram Builder
Click on the Add View to Diagram Builder button to add tables, and the green play button to select the type of diagram to build. Use the red button to clear the table selection from the Builder.
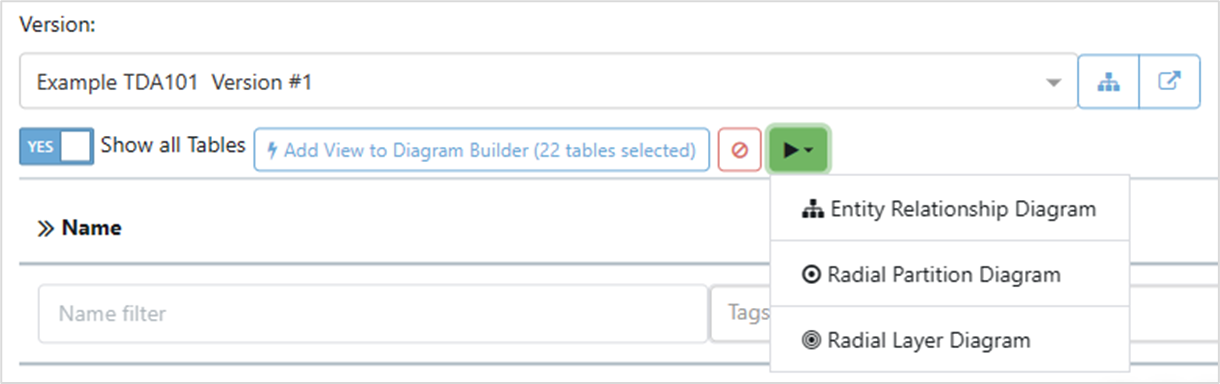
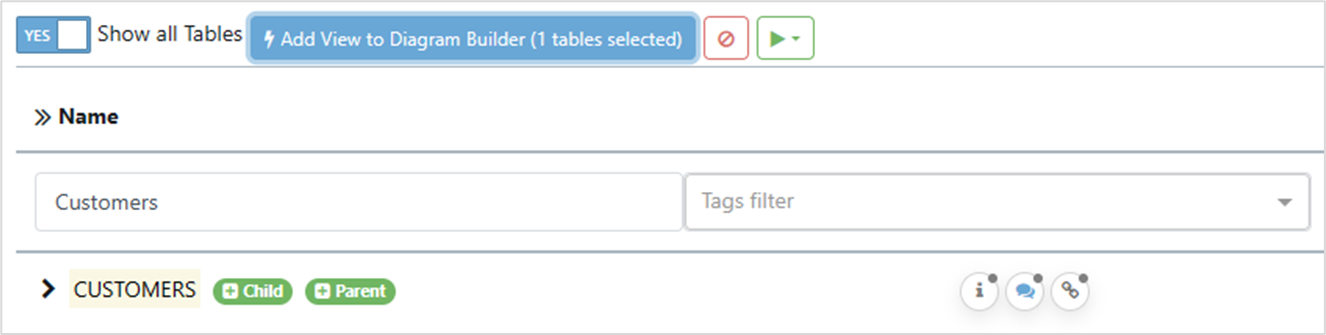
Diagram Builder will include any tables that are visible in the list of tables. Use the filter to select tables that match your requirements. If you search for a table and click Add View to Diagram Builder, only one table will be added. If no filter is used, Diagram Builder will select all the tables.
If you expand the table to include its relationships and then click on Add View, Diagram Builder will include those tables in the diagram.
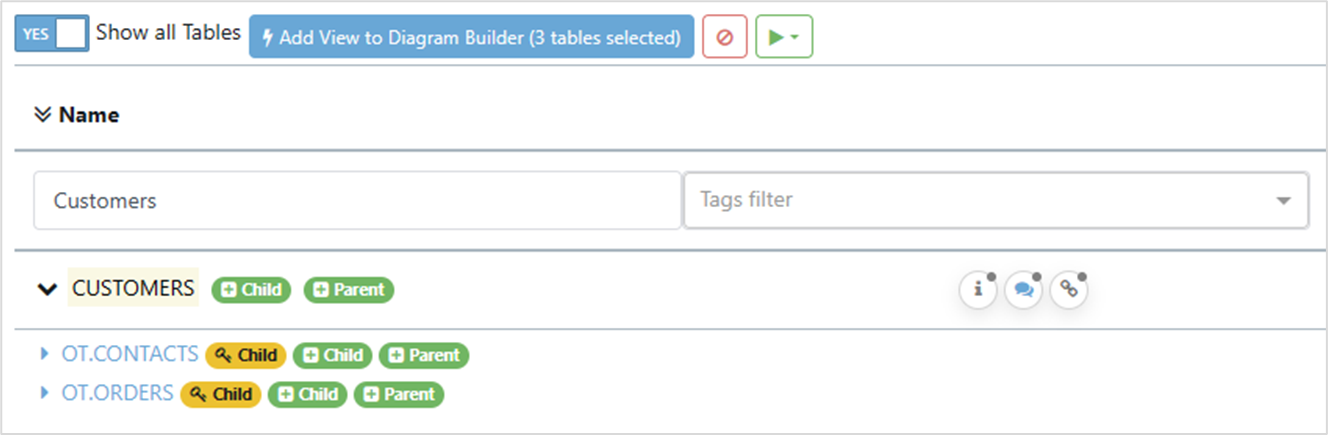
Diagram Builder is additive: If you want to show the relationships between specific tables, filter for each table individually and add them to the Builder one at a time.
1 | 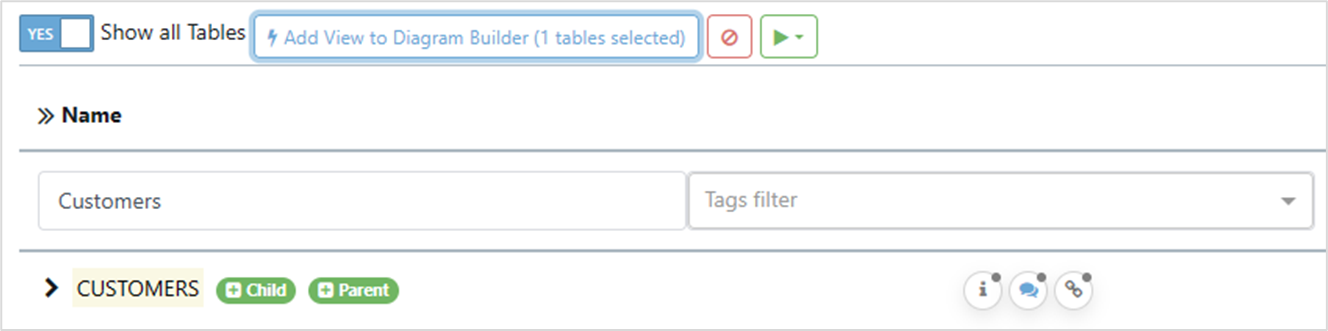 | 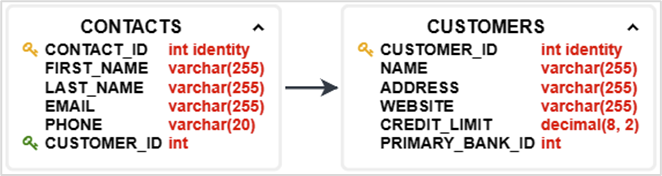 |
2 | 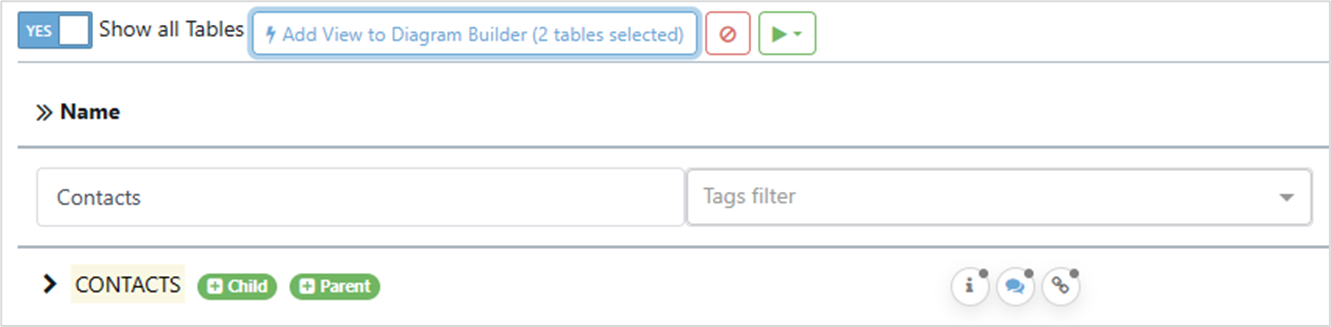 |
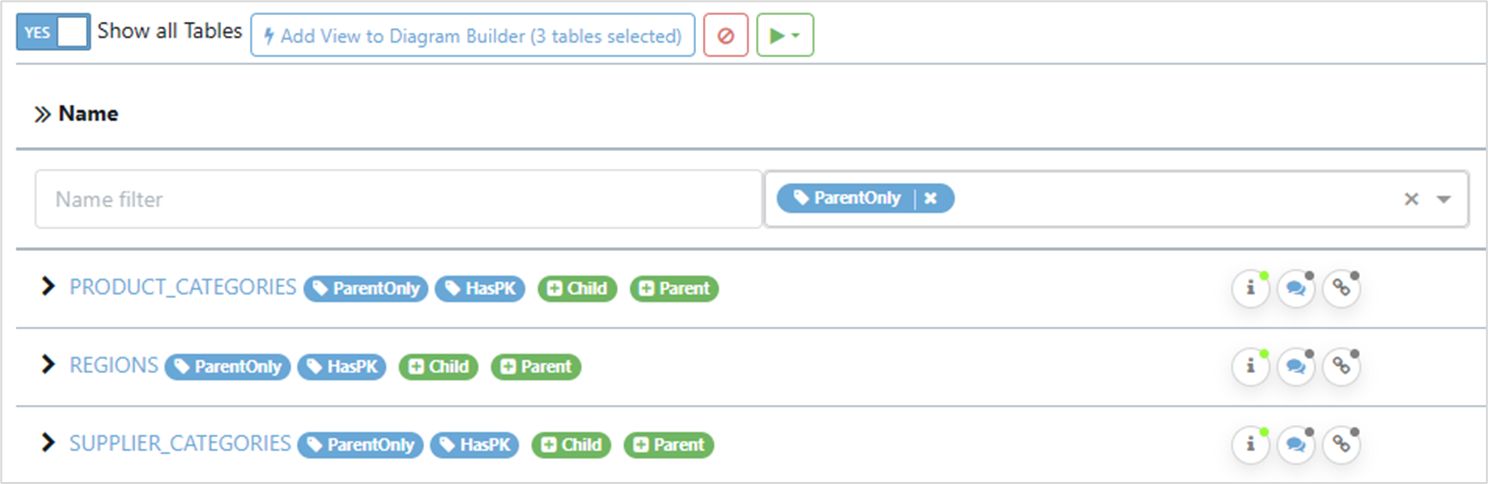
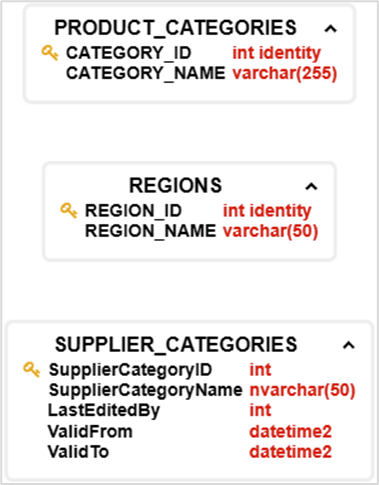
Because Diagram Builder uses what is displayed in the filter, you can use any filter option. In this case we have added tags that define some tables as ParentOnly (they don’t have children, so are likely to be reference tables).
 |  |
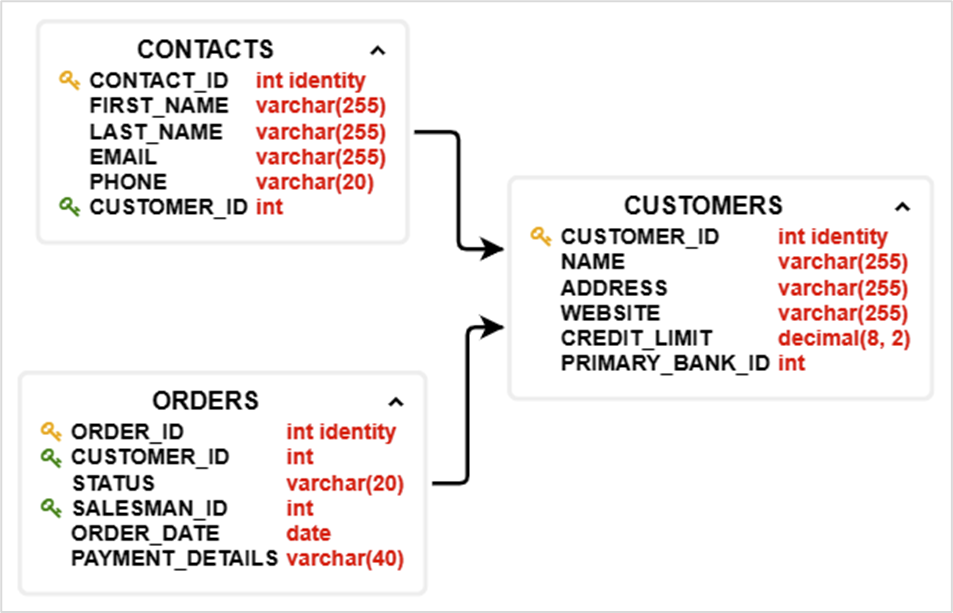
Entity Relationship Diagram
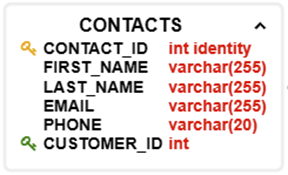
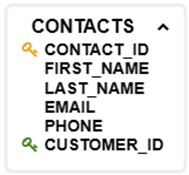
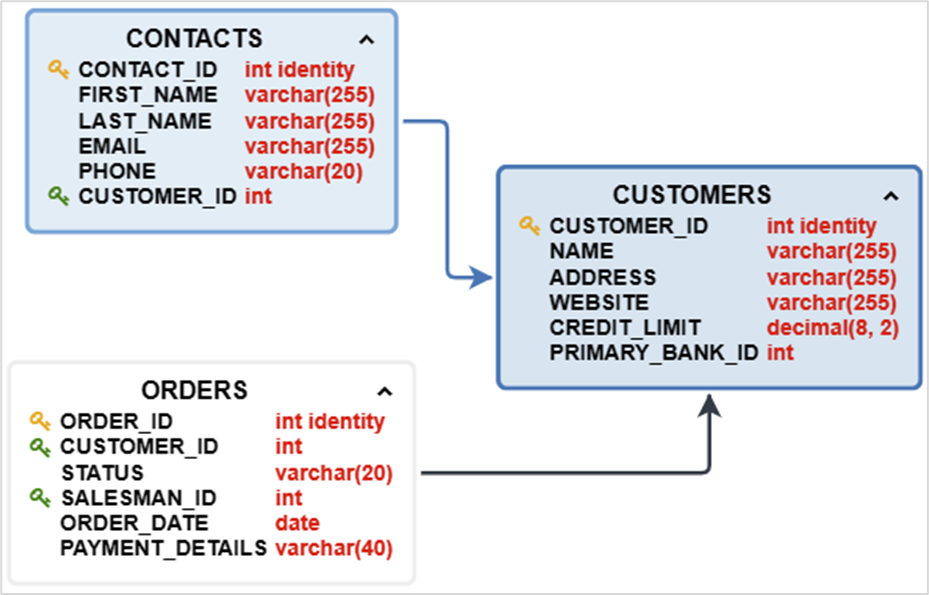
Entity relationship diagrams display the structure of a database in a flowchart form. The default settings show the table names, the columns and their data types, the private (gold) and foreign (green) hard and soft keys, and arrows showing how the foreign keys link the tables.
The Buttons
Buttons at the top right of the diagram provide you with controls:
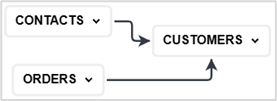
 | Toggle Collapse/Expand all Collapses and expands all but the table name
|
 | Settings Described below |
 | Re-Layout Use this if changes made in the Settings have made the diagram difficult to read |
 | Download as PNG Download an image of the whole diagram. |
 | Zoom out |
 | Zoom in |
 | Fit to view Automatically zoom to fit the whole diagram in the visible canvas |
The settings button
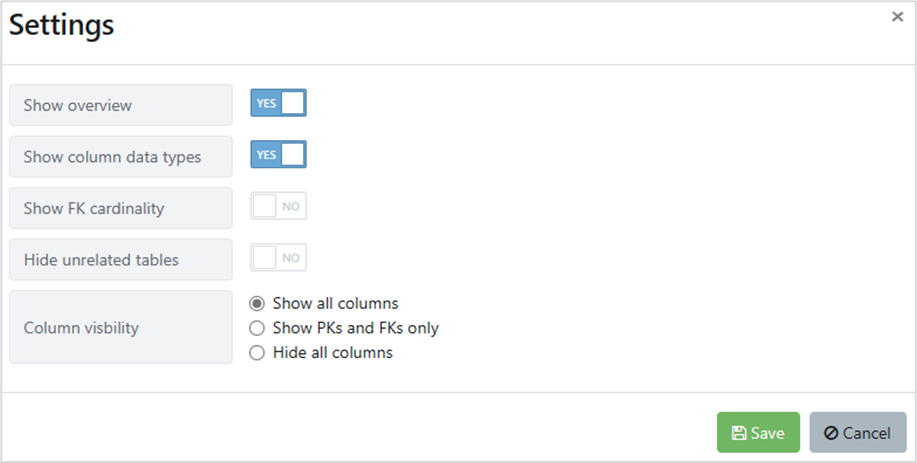
Clicking on the Settings button displays the Settings box. The defaults are shown.
The controls are as follows
Control | Description | Set to Yes | Set to No |
| Toggles display of the overview panel in the bottom-left of the window | 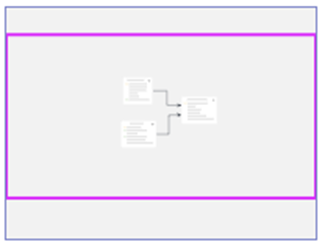 |
|
 | Toggles display of the data types |
|
|
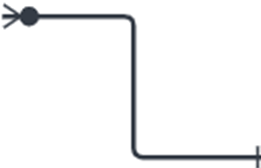
| Toggles the arrow type |
| 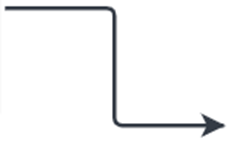 |
| Toggles display of tables that exist in the definition but don’t have relationships | 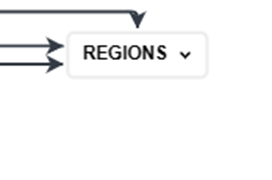 | 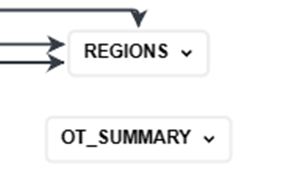 |
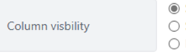 | Displays all columns |  | |
Displays only columns that are primary keys or have foreign key relationships | 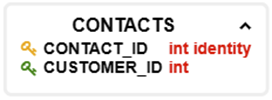 | ||
Displays only table names |
| ||


Controls in the Diagram
Clicking in a white space and immediately moving the mouse will move the table. Clicking in a white space and moving the mouse after a pause will start a selection box.
Each table has an arrow in the top right corner. Clicking on this will collapse or expand the table.
Hovering the mouse pointer over a table highlights that table and related tables
Clicking-and-holding on a table and moving the mouse will move the table. This can be useful if any of the relationship arrows are unclear.
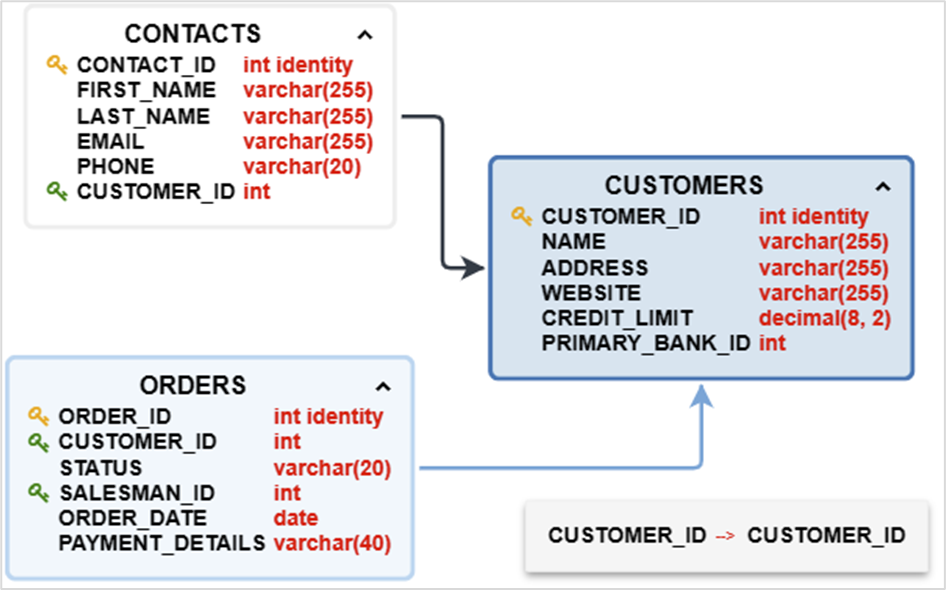
Hovering the mouse pointer over a relationship arrow highlights the related tables, and displays the relationship.
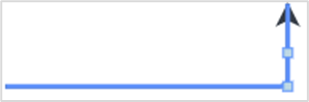
Clicking on a relationship arrow displays handles that allow you to stretch the arrow. This can be useful if any of the relationship arrows are unclear.
Radial Partition Diagram
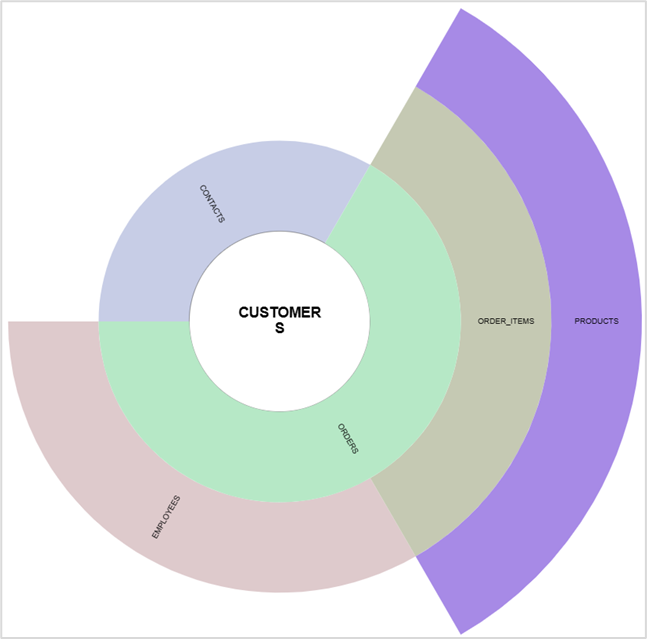
The Radial Partition Diagram shows the degrees of separation between a selected database and the others it is related to: it helps you understand how tables relate and how many steps there are between tables. Clicking on a coloured segment selects it as the central node. The diagram is re-drawn showing how the tables relate with that new focus.
The Buttons
Buttons at the top right of the diagram provide you with controls:
 | Settings Described below |
 | Re-Layout Use this if changes made in the Settings have made the diagram difficult to read |
 | Download as PNG Download an image of the whole diagram. |
 | Zoom out |
 | Zoom in |
 | Fit to view Automatically zoom to fit the whole diagram in the visible canvas |
The settings button
Clicking on the Settings button displays the Settings box. The defaults are shown.
Control | Description |
| Max layers is the number of steps out from the centre the diagram is allowed to go. The default is 4. This may not be enough to display all the steps between tables. Use this control to set how many steps you need to see. |
| Layers thickness sets how wide all the rings outside the centre are. The effect is like zoom, but doesn’t change the size of the text, which can help with readability. |


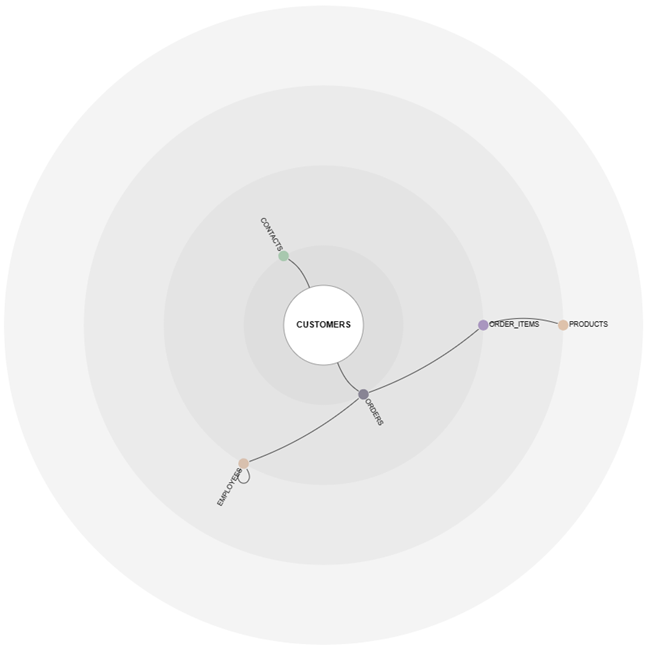
Radial Layer Diagram
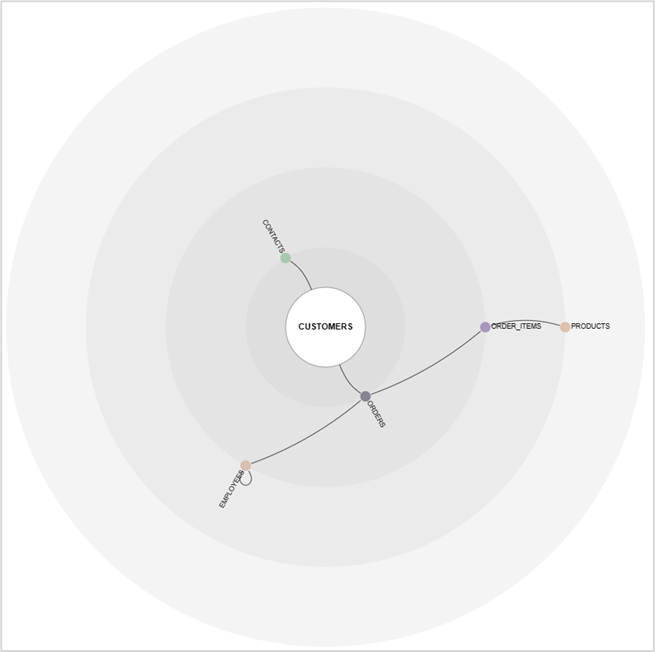
Like the radial partition diagram, the Radial Layer Diagram can show the degrees of separation between tables, however, the lines show the relationships between the tables. Clicking on a table name selects it as the central node. The diagram is re-drawn showing how the tables relate with that new focus.
The Buttons
Buttons at the top right of the diagram provide you with controls:
 | Settings Described below |
 | Re-Layout Use this if changes made in the Settings have made the diagram difficult to read |
 | Download as PNG Download an image of the whole diagram. |
 | Zoom out |
 | Zoom in |
 | Fit to view Automatically zoom to fit the whole diagram in the visible canvas |
The settings button
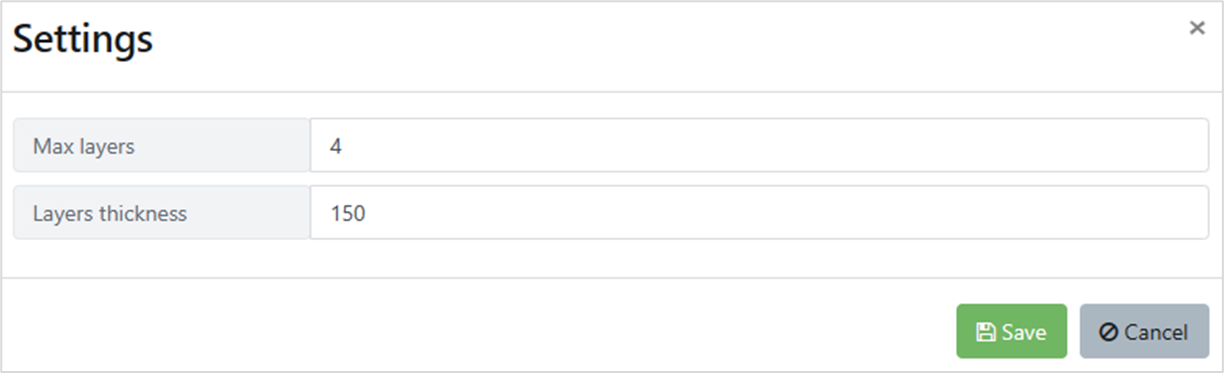
Clicking on the Settings button displays the Settings box. The defaults are shown.

Control | Description |
 | Max layers is the number of steps out from the centre the diagram is allowed to go. The default is 4. This may not be enough to display all the steps between tables. Use this control to set how many steps you need to see. |
| Layers thickness sets how wide all the rings outside the centre are. The effect is like zoom, but doesn’t change the size of the text, which can help with readability. |
