After tests generated by Quality Modeller have been executed, the results can be analysed. This is possible at the Model level, providing a granular view of exactly which paths through the system logic functioned as expected, and those which threw up test failures. Dashboards further provide visual overviews of test runs for a given period, by context or globally, and automated test results can also be downloaded.
This analysis provides the broad view needed for effective test management, and the granular information needed to identify the root cause of defects. Test and development resources can then be targeted to remediate existing defects, while testing focusing on higher risk functionality during future test runs.
Inspecting Run Results at the Model Level
To inspect run results at the Model level, log-in to Quality Modeller and open the Model from which the automated tests were generated.
Next, navigate to the "Test Generation" tab of the top bar menu and Click "Tests":

This will open the Scenarios sidebar:
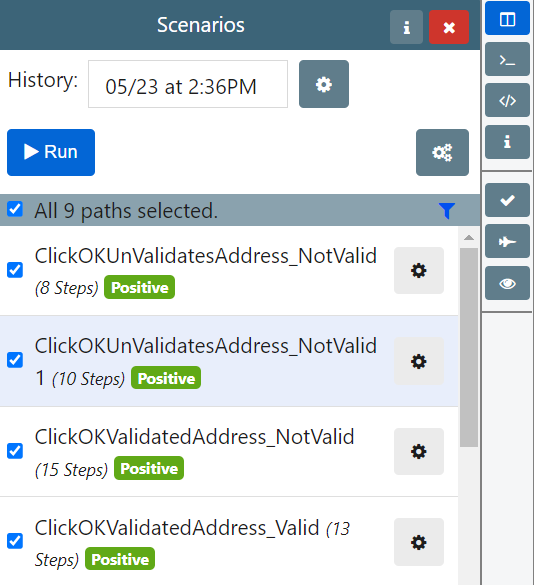
The Scenarios sidebar provides pass/fail results by test case. These results are displayed by row, as either a green "Passed" icon, or a red "Failed".
Results are browsed by test generation "History": the date and time when the Test Cases were generated.
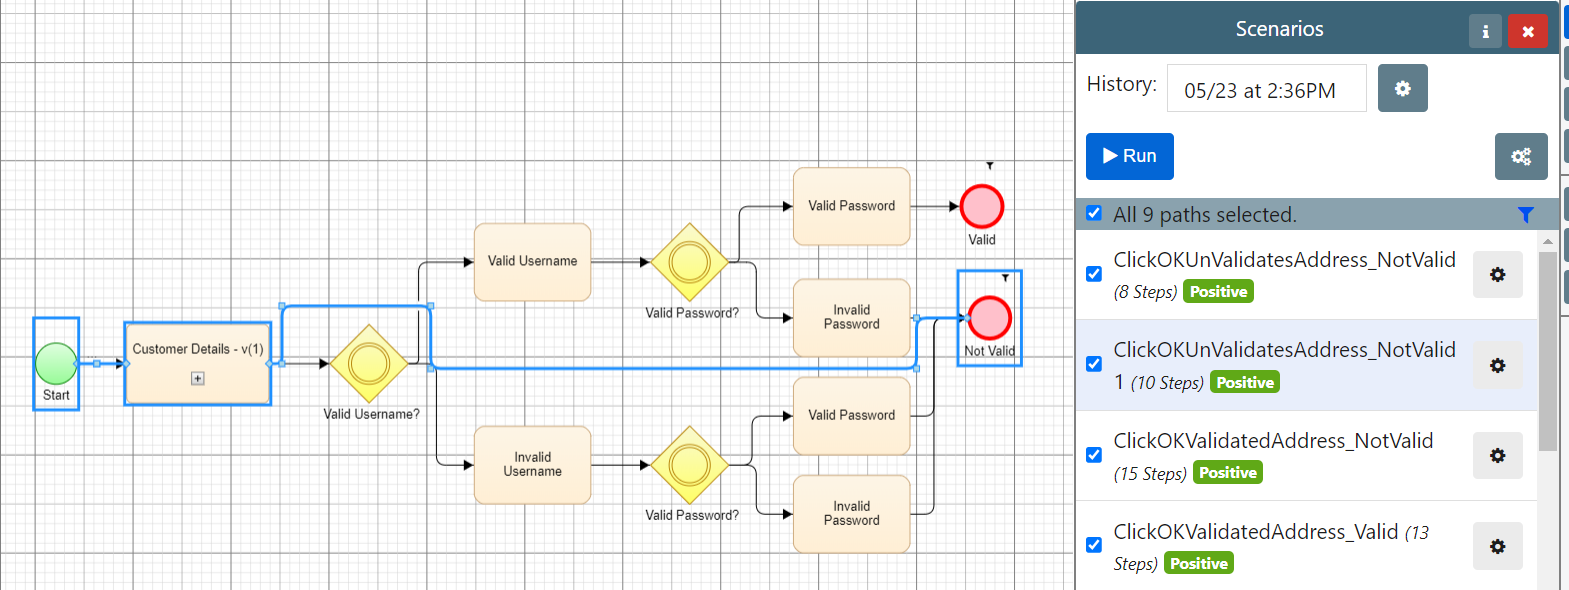
Run results are displayed by test case. Clicking a test case row will highlight the path through the system model that the automated test has exercised:
You can analyse the Results history for a given test case from the Scenarios sidebar. Select the Cog icon next to the test cases and select "Results". This will display the run result and Job Engine ID for the test case:
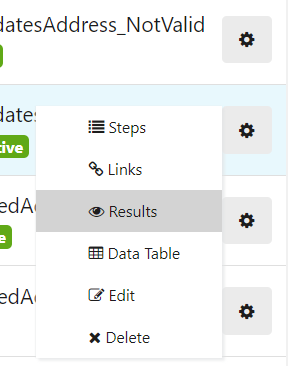
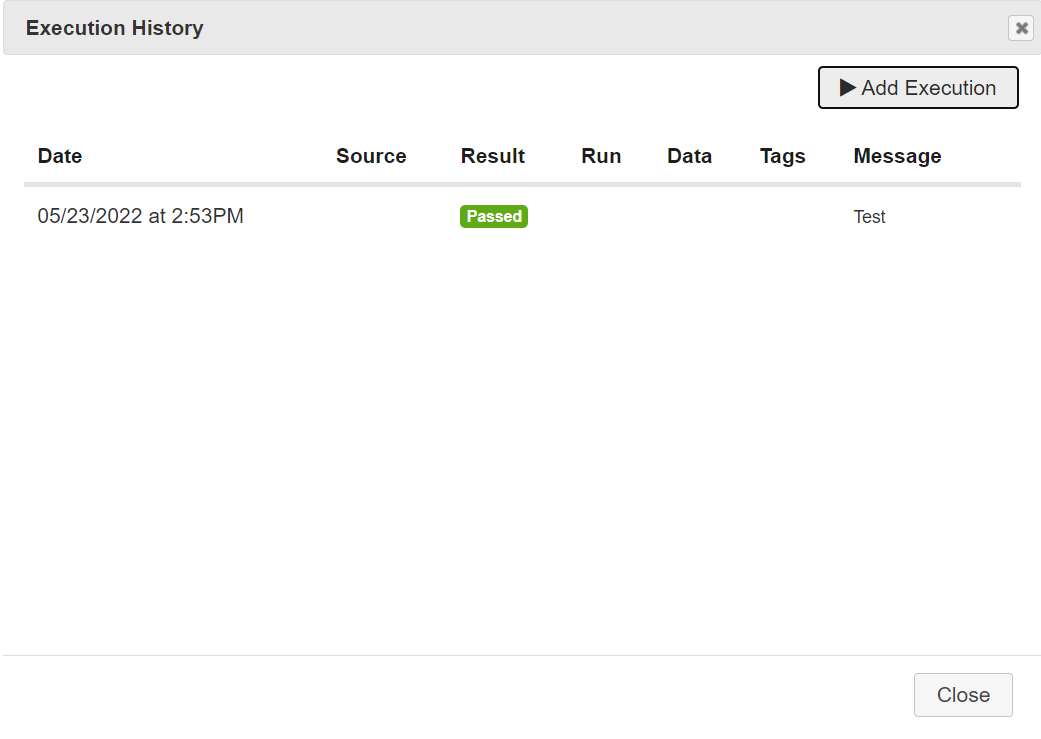
If you execute automated tests while the model is open, click the cog icon and then "Refresh". This will refresh the run results associated with the model.
The Run Results Page Explained
You can review the results of automated test runs in the Run Results page.
The Run Results page allows you to view results graphically for every run and test case during a given time period.
You can also review the results for individual test cases and test runs.
To open the Run Results page, select the "Results" option in the sidebar menu.
Filter Results Shown
The Run Results page displays results by context and date range. To filter by context, use the context drop-down menu. The Global context will display all tests executed across every project and release. Alternatively, filter run results by Project and Releases.
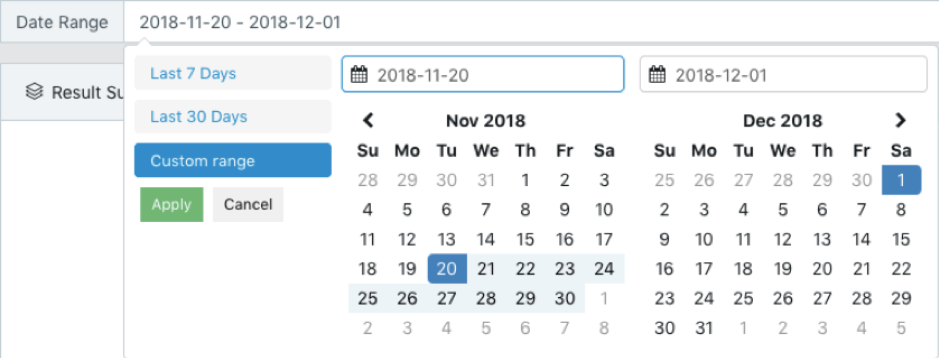
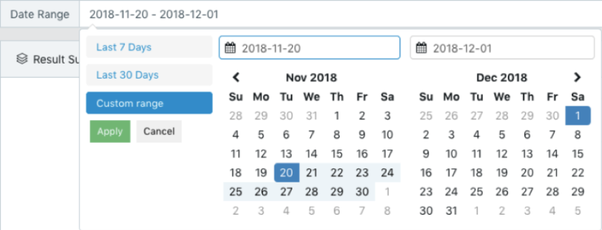
To filter the results by date, click the Date Range box at the top of the page. Next, select either "Last 7 Days" or "Last 30 Days". Alternatively, click "Custom range", and specify a start and end date using the two calendars. Click "Apply" to display graphs for the custom date range.
Result Graphs
The Run Results page provides two graphs for every Test Case executed within the specified context and time period.
The "Results Summary" graph provides a pie chart of the number of tests that have passed, and those that have failed.
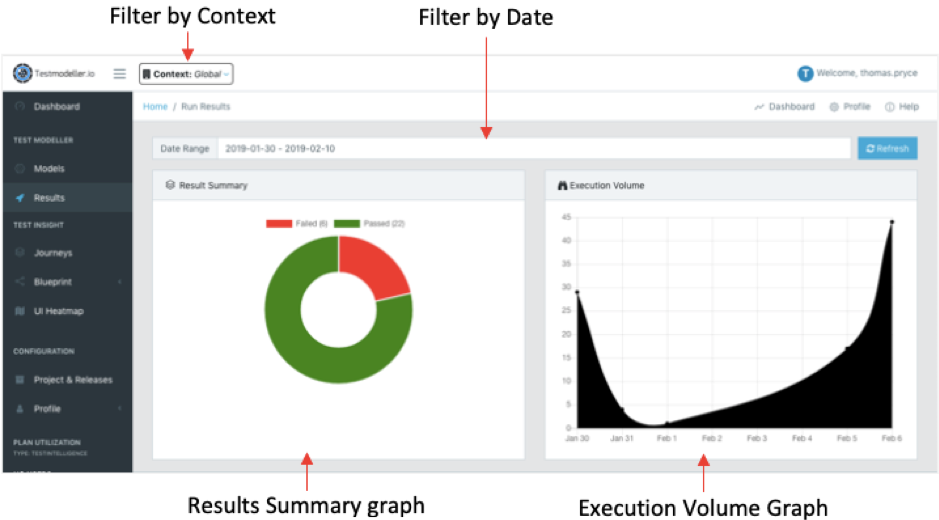
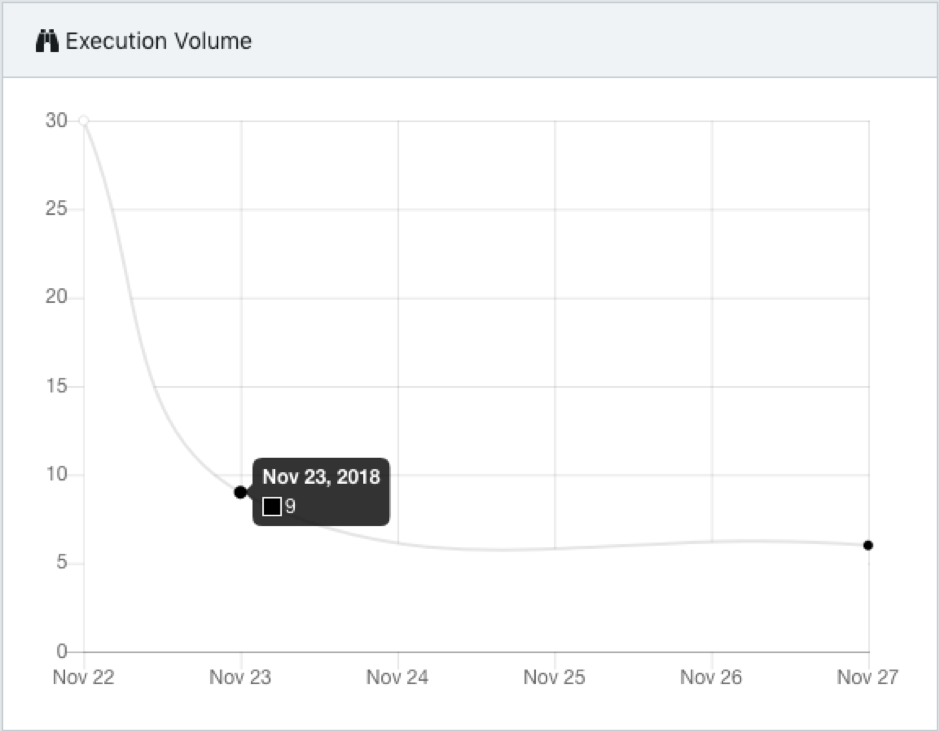
The "Execution Volume" graph displays the number of tests executed over time.
Days with execution runs are represented by points plotted on the graph. Hover over a point to review the number of tests executed on that day:
Browse Results by Individual Run or Test Case
The graphs reflect the results of every test run executed during the specified time period and context.
Scroll down to the "Results" table to instead browse run results by individual test runs or test cases.
Browse Results by Run
The "Home" tab displays every test run that has been executed within the specified time range and context.
Runs are displayed row-by-row, and are ordered by the time of their "Last Execution". The execution duration is also displayed:
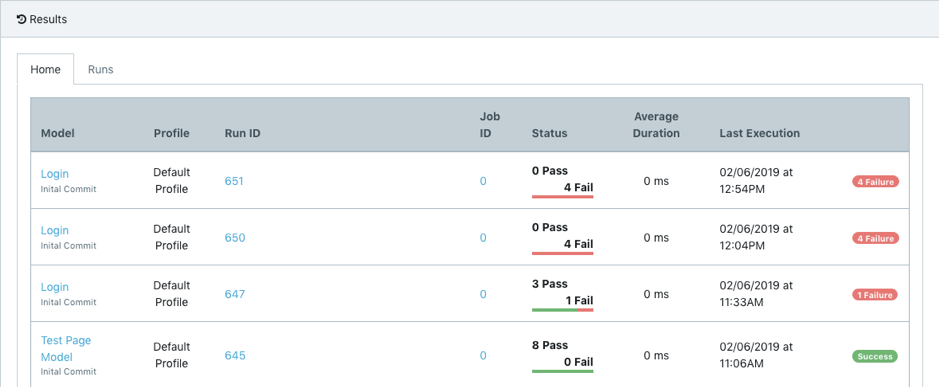
Clicking the Model name for an individual run will open the model from which the automated tests were generated. The "Profile" tells you the coverage profile that was used to generate the tests. Open the model and select the relevant coverage profile to review the run results at the model level.
The "Status" provides an overview of the number of tests that passed, and those that failed. The row will be labelled "Success" if every test passes; otherwise, the label will be red.
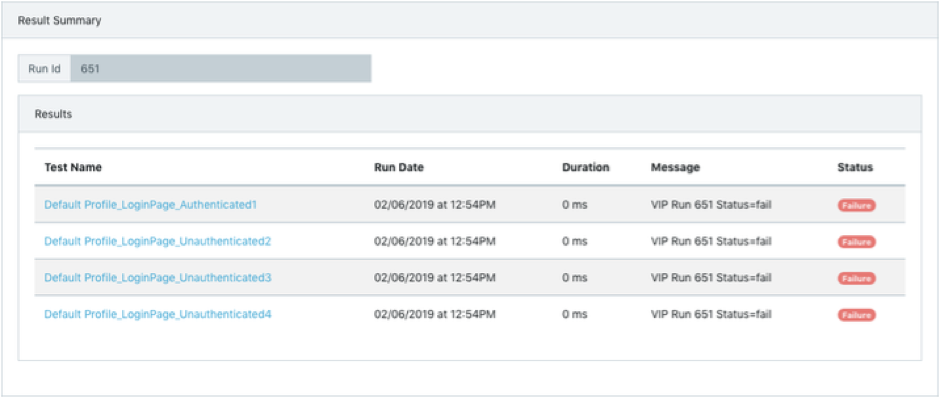
You can review the results of the individual test cases executed during an individual run by clicking the Run ID:
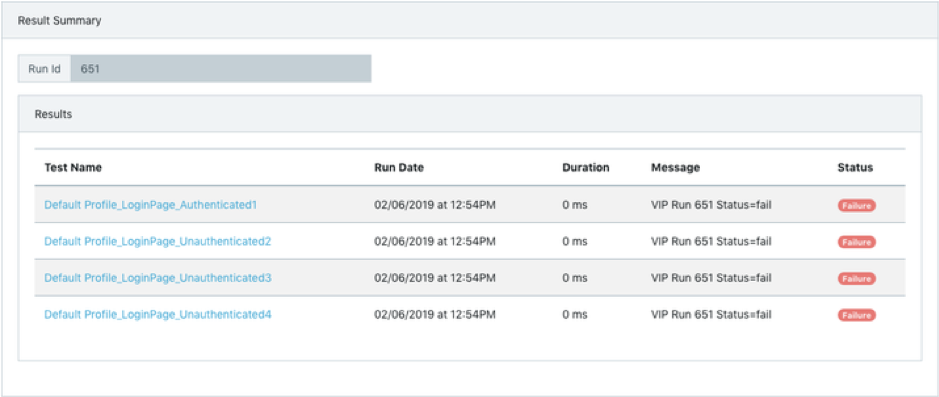
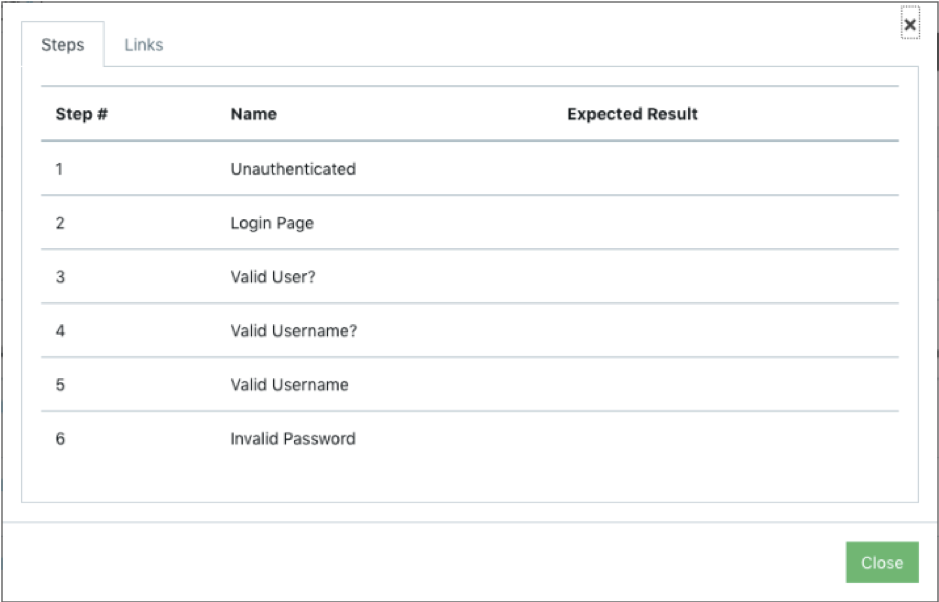
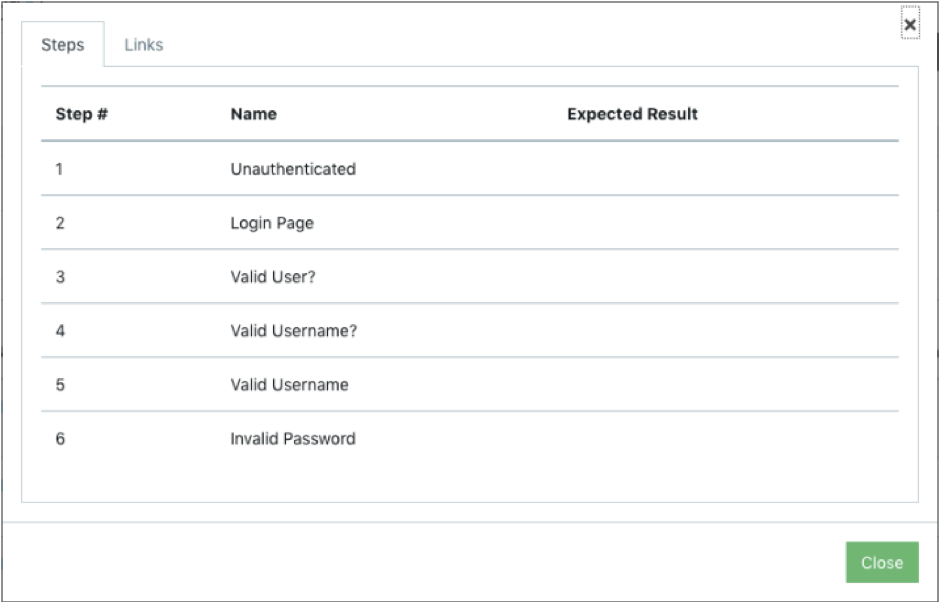
Clicking the Test Name in this view displays the test steps and expected results, as well as any links:
Browse Results by Test Case
The "Runs" tab of the results table allows you to browse the results of every individual test case executed within the time period and context you have specified.
These are ordered chronologically, row-by-row, based on the time of execution:
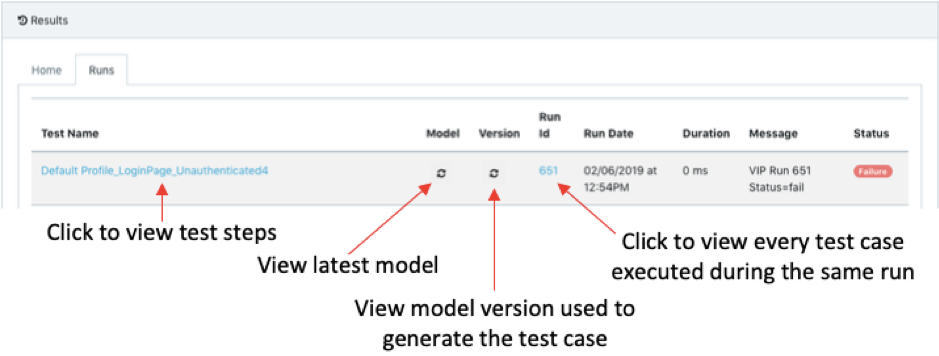
The duration is displayed, as is the pass/fail result of the test.
Clicking the reload symbol under "Model" loads the latest version of model from which the test case was generated.
This might be different to the model from which the tests were created; clicking reload in the "Version" column instead loads the version of the model from which the test case was created.
Clicking the Test Name displays the test steps associated with that test case, along with any expected results and links:
Clicking the Run ID displays the results for every test case executed during the same run:
